
Learn
Best Video Streaming CDN in 2026? 7 Providers
Best CDN for Video Streaming in 2026: 7 Providers Compared A single rebuffer event at the two-second mark costs you 8% ...
We modeled an identical 50 TB monthly workload across six CDN providers in Q2 2026. The invoice spread was 4.7× between the most and least expensive option, and the cheapest provider on paper wasn't the cheapest in practice once request fees and regional surcharges landed. Any serious CDN pricing comparison in 2026 has to account for billing mechanics, not just headline rates. This article gives you the framework: current per-GB rates for every major provider, a workload-profile decision matrix, the cost drivers that actually move your invoice, and the optimization levers you can pull before your next renewal.

Three structural shifts happened between late 2024 and now that make older pricing guides unreliable. First, Cloudflare continued folding CDN bandwidth into platform bundles, making per-GB extraction nearly impossible on their Pro and Business plans. Second, AWS revised CloudFront's free-tier and regional multipliers in late 2025, compressing NA/EU rates but widening the gap to APAC and LATAM. Third, several mid-tier providers (KeyCDN, StackPath) either sunset products or restructured, narrowing the field of transparent pay-as-you-go CDN options. The result: in 2026, you're comparing at least four distinct billing models (metered egress, plan-bundled, committed-spend, and volume-tiered) against each other. List price per GB is a starting point, not an answer.
All rates below reflect publicly listed pricing as of April 2026 unless otherwise noted. Enterprise-negotiated rates are lower but not publicly verifiable.
| Provider | Billing Model | NA/EU $/GB (public) | APAC $/GB (public) | Request Charges |
|---|---|---|---|---|
| Amazon CloudFront | Metered egress + requests | $0.085 (first 10 TB), drops to $0.020 at 5 PB+ | $0.110–$0.140 | $0.0075–$0.0100 per 10K HTTPS |
| Cloudflare | Plan-bundled (Pro $25/mo, Biz $250/mo, Ent custom) | $0 transfer on all plans (bandwidth included) | Same (but subject to ToS limits on serving non-web content) | None explicit; Workers/R2 billed separately |
| Fastly | Metered or committed packages (from ~$1,500/mo) | $0.080 (first 10 TB), negotiated lower at commit | $0.190 | $0.0090 per 10K requests |
| Akamai | Custom enterprise contracts | ~$0.020–$0.050 (negotiated, volume-dependent) | ~$0.050–$0.120 | Bundled into contract |
| Bunny.net | Pay-as-you-go metered | $0.010 (standard), $0.005 (volume tier) | $0.030–$0.060 | None (transfer-only billing) |
| BlazingCDN | Volume-tiered monthly | $0.004/GB (25 TB tier), down to $0.002/GB (2 PB tier) | Included in blended rate | None |
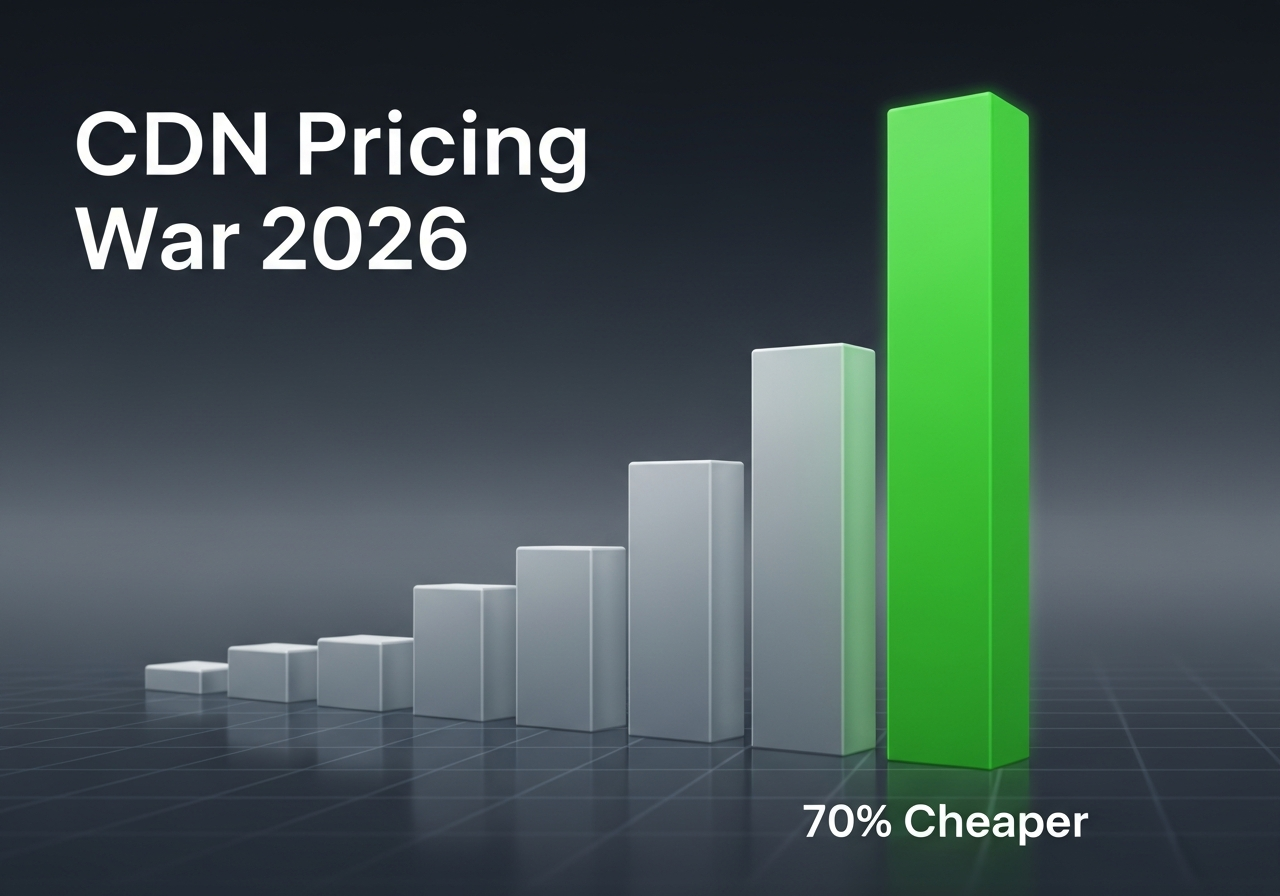
The gap is stark. At 50 TB/month NA/EU delivery, CloudFront's blended rate lands around $0.060/GB ($3,000+), Bunny.net around $0.010/GB ($500), and BlazingCDN at $0.004/GB effective on the 100 TB tier ($350/month flat). That is a 70%+ cost difference between the most expensive mainstream option and the cheapest volume-tier provider.
No single provider wins every scenario. The matrix below maps workload characteristics to the provider whose billing model and architecture best fit. This is the piece most CDN price comparison articles omit: matching billing physics to traffic physics.
| Workload Profile | Dominant Cost Factor | Best-Fit Provider(s) | Why |
|---|---|---|---|
| VOD / large file distribution, 50+ TB/mo | Transfer $/GB | BlazingCDN, Bunny.net | No request fees; lowest per-GB at volume |
| Game patch / software update distribution, 200+ TB/mo | Transfer $/GB at extreme volume | BlazingCDN, Akamai (negotiated) | BlazingCDN at $0.002–$0.003/GB; Akamai competitive only with multi-year commit |
| API-heavy / small-object (thumbnails, JSON, config) | Request charges per 10K | Cloudflare, Bunny.net | Zero or negligible per-request billing |
| AWS-native stack, S3 origin | Origin egress + operational fit | CloudFront | $0 S3-to-CloudFront transfer; consolidated billing; IAM integration |
| Edge compute / real-time personalization | Compute invocations + latency budget | Cloudflare (Workers), Fastly (Compute@Edge) | Sub-millisecond cold starts; integrated KV/object stores |
| Live streaming (HLS/DASH), global audience | Transfer + request + APAC surcharges | BlazingCDN (cost), Akamai (coverage depth) | Blended regional rate matters; BlazingCDN's flat tiers absorb APAC without surcharges |
This matchup gets searched heavily, so let's be precise. At 10 TB/month of predominantly NA/EU HLS video delivery (assume 6s segments, ~110 requests/GB), here's what Q2 2026 public pricing yields:
That's a 9.3× difference. CloudFront's value proposition here is not the rate card; it's zero-cost S3 origin egress, Lambda@Edge for manifest manipulation, and unified AWS billing. If those features aren't critical to your architecture, you're paying a steep premium for them.
For teams delivering sustained high-volume workloads—VOD libraries, game patches, software repos, enterprise media—transfer cost per GB is the line item that dominates. BlazingCDN's volume tiers start at $0.004/GB ($100/month for 25 TB) and drop to $0.002/GB at the 2 PB tier ($4,000/month for 2,000 TB). There are no request charges and no regional surcharges layered on top. The platform delivers 100% uptime SLA with fast scaling under demand spikes, providing stability and fault tolerance comparable to CloudFront at a fraction of the cost. Clients like Sony use BlazingCDN for exactly this kind of large-scale delivery. If your workload is transfer-heavy and predictable, BlazingCDN's volume pricing is worth modeling against your current invoice.
Before you renegotiate or migrate, there's usually 15–30% savings sitting in your current configuration.
Pull 30 days of production data and compute the following. Without these numbers, any CDN price comparison you run is guesswork.
Then apply each provider's rate card to your actual traffic shape. The effective delivered cost per GB = total monthly CDN invoice ÷ total delivered GB. Break it down per region and per workload class to find where the money actually goes.
On raw transfer cost per GB, BlazingCDN's volume tiers ($0.002–$0.004/GB) and Bunny.net's standard rate ($0.005–$0.010/GB) are the lowest publicly listed options as of Q2 2026. However, cheapest depends on workload: CloudFront costs $0 for S3 origin transfer, and Cloudflare bundles bandwidth into fixed plan fees, which can be cheaper for small-to-mid traffic sites with high request counts.
Public pay-as-you-go rates range from $0.002/GB (BlazingCDN at 2 PB+ volume) to $0.085/GB (CloudFront at first 10 TB, NA). Negotiated enterprise rates on Akamai and Fastly typically fall between $0.020–$0.050/GB for NA/EU. The effective cost per GB on your invoice will also depend on request charges, regional mix, and add-on services.
For HLS/DASH VOD and live streaming, providers without request charges (Bunny.net, BlazingCDN) have a structural billing advantage because segmented video generates high request counts per GB. At 50+ TB/month, BlazingCDN's effective rate of $0.003–$0.004/GB with no request surcharges makes it the cheapest option for sustained video delivery in 2026.
Cloudflare does not charge per-GB transfer fees on any plan, including the free tier. However, its Terms of Service restrict serving non-HTML content (video, large binaries) as the primary use case on free and Pro plans. Enterprise plans lift these restrictions but come with custom pricing that can exceed metered competitors for high-bandwidth media delivery.
For 100 TB/month of mixed web and media content, CloudFront's blended metered rate lands around $0.040–$0.060/GB ($4,000–$6,000/month) before request fees. Cloudflare Enterprise contracts for this volume are custom but typically negotiate in the $3,000–$8,000/month range depending on features included. The real comparison requires specifying workload type, because Cloudflare's pricing includes Workers, R2, and security features that CloudFront bills separately.
Pull your last 30-day invoice and divide total CDN spend by total edge-delivered GB. Then segment by region and workload class. Compare that effective blended rate, not list prices, against other providers' rate cards applied to your actual traffic distribution. Include origin egress costs if your origin is on a cloud provider that charges for outbound transfer.
Export your CDN access logs and billing data for the last 30 days. Calculate your effective cost per delivered GB, your request-to-GB ratio, and your regional traffic split. Then re-price your actual workload against three providers using the rates in this article. Most teams that do this exercise find a 30–60% gap between what they're paying and what they could be paying. The numbers don't lie, but they do require you to actually pull them. Start there.
Learn
Best CDN for Video Streaming in 2026: 7 Providers Compared A single rebuffer event at the two-second mark costs you 8% ...

Learn
Video CDN Providers Compared: BlazingCDN vs Cloudflare vs Akamai for OTT If you are choosing a video CDN for an OTT ...

Learn
Video CDN Pricing Explained: How to Stop Overpaying for Streaming Bandwidth Video already accounts for 38% of total ...