Infrastructure
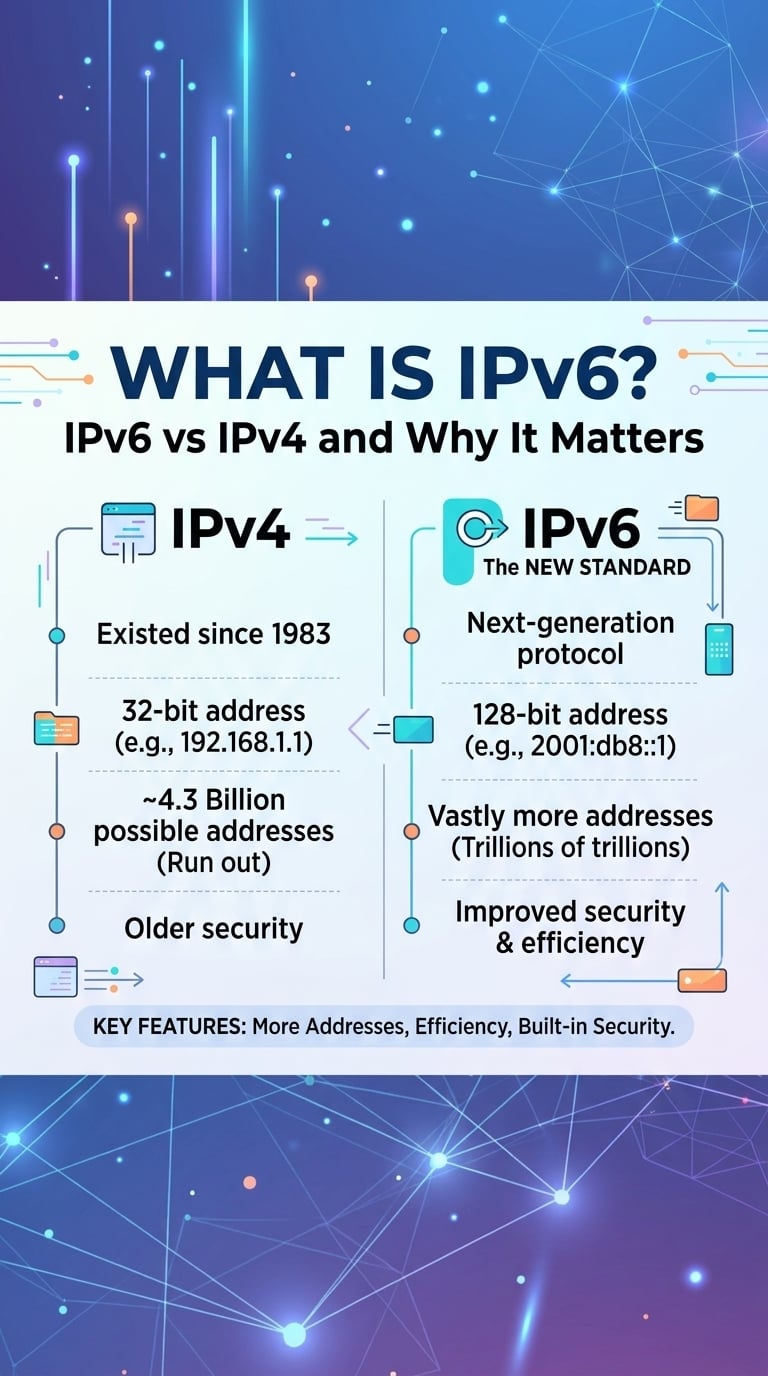
What Is IPv6? IPv6 vs IPv4 and Why It Matters
The short answer to what is IPv6: Internet Protocol version 6 is the network-layer protocol that replaces IPv4's 32-bit ...
Public measurements say the majority of global internet traffic now leaves a cache, not an origin. A widely cited industry forecast published in 2018 projected that 72% of all internet traffic would cross content delivery networks by 2022, up from 56% in 2017. Measurements from 2022 put video at roughly two thirds of downstream volume, and video is the traffic CDNs are built to cache. This article covers what that CDN internet traffic share means in practice: how caching and peering reroute bytes, a worked model of what one point of hit ratio is worth at 500 TB a month, and the failure modes that show up when traffic engineering goes wrong.
An industry forecast published in 2018 projected that 72% of global internet traffic would be carried by content delivery networks by 2022, up from 56% in 2017. Public traffic measurements from 2022 show video at roughly 65% of downstream internet volume and six large platforms generating close to half of all bytes. Most internet traffic is therefore cached, replicated content served from inside or next to the viewer's access network.
No single dataset measures every byte on the internet, so the CDN share has to be triangulated from three kinds of public data: vendor traffic forecasts, application-level measurements from fixed and mobile operators, and traffic dashboards published by large network operators. They measure different things and should not be blended into one precise figure.
The last widely cited forecast put the CDN traffic share at 72% of global internet traffic by 2022. No comparable public forecast has replaced it since. Our estimate for 2026 is that the share sits above 70%, because the largest traffic sources (video, software updates, game downloads) are almost entirely delivered from caches owned by either commercial CDNs or the platforms themselves.
That last distinction matters. A large fraction of "CDN traffic" is private CDN traffic: streaming and social platforms run their own cache fleets and deliver from them. Commercial CDNs carry the rest of the cacheable internet, which is where most engineering teams buy capacity.
Concentration is the underrated number. When half of all bytes come from a handful of senders that operate their own caches, the remaining market for commercial delivery is long-tail content with lower request density per file, which makes hit ratio harder to earn.
CDNs reshape traffic in three ways: they collapse many identical requests into one origin fetch, they move delivery onto short paths through peering and in-network caches, and they steer requests with DNS or Anycast routing toward capacity that is healthy and close. Each of these shifts cost and latency in a different part of the network.
Request hit ratio and byte hit ratio diverge on mixed workloads. A site serving millions of small thumbnails and a few thousand multi-gigabyte installers can show a 90% request hit ratio and a 99% byte hit ratio at the same time, or the reverse if the large files sit in the long tail. Origin egress bills follow bytes, while origin CPU and connection pressure follow requests, so track both per content class.
Tiered caching changes the math further. An origin shield (a mid-tier cache in front of the origin) means an edge miss becomes a shield hit, so the origin sees one fetch per file per shield instead of one per edge location. Request coalescing adds the same protection during the first seconds after a release, when thousands of edges miss simultaneously.
The cheapest byte is one that never crosses paid transit. Large content networks deliver most of their volume through settlement-free peering at internet exchange points, private network interconnects with access providers, and caches hosted directly inside ISP networks. Those in-network caches fill overnight and then serve peak-hour demand without touching the backbone.
For a viewer, that path shortening is the main source of latency gains: a cache 5 to 20 ms away instead of an origin 80 to 150 ms away (typical ranges, varying by region). For the network, it moves congestion from long-haul links to last-mile access, where operators are better equipped to absorb it.
DNS-based steering picks an edge per resolver and can apply load and health data, but it inherits resolver location errors and TTL lag. Anycast announces the same prefix from many sites and lets BGP pick the path, which converges on failure without waiting for caches to expire, but it routes on network topology rather than measured latency. Many large networks combine both.
Assume 500 TB a month delivered to users, origin in a public cloud, and internet egress from that cloud at $50 to $90 per TB (an estimate based on typical public cloud list rates, which have sat near $0.05 to $0.09 per GB for years). Average delivered throughput is 500 TB times 8 bits divided by 2.59 million seconds, about 1.5 Gb/s, with peaks commonly 2 to 3 times higher.
| Byte hit ratio | Origin egress per month | Origin egress cost (estimate) | Average origin throughput |
|---|---|---|---|
| 85% | 75 TB | $3,750 to $6,750 | about 231 Mb/s |
| 90% | 50 TB | $2,500 to $4,500 | about 154 Mb/s |
| 95% | 25 TB | $1,250 to $2,250 | about 77 Mb/s |
| 98% | 10 TB | $500 to $900 | about 31 Mb/s |
Moving byte hit ratio from 90% to 98% cuts origin egress by 80%, so the last few points of hit ratio are worth more than the first eighty.
The non-linearity is the point. Each point between 95% and 99% removes a fifth or more of the remaining origin load, which is why shielding, coalescing and long cache lifetimes for versioned files pay back faster than most tuning work. BlazingCDN reports a 96%+ average cache hit ratio and includes origin shield and request coalescing on every plan of its Anycast CDN for high-volume file and video delivery, which is the combination that moves the bottom rows of this table.
Global events produce the sharpest traffic shapes. A major football final or a large game launch concentrates demand on a few files within minutes, and the stress lands on cache fill rather than on delivery capacity. A 50 GB game build released to one million players is 50 PB of potential demand; at a 99% byte hit ratio the origin still serves 500 TB, which is why publishers pre-warm caches before the release window.
Live streaming spreads the same problem over time: every viewer requests the newest HLS or DASH segment within a few seconds, so each segment is a miniature release. Short segment durations raise request rates, and coalescing is what keeps the origin seeing one fetch per segment per shield rather than thousands.
Distributing delivery across many sites also distributes attack traffic. Volumetric floods aimed at a cached hostname are absorbed by edge capacity, and origin addresses that are never published are harder to target directly. TLS 1.3 at the edge protects data in transit and shortens handshakes. Mitigation of application-layer attacks, however, needs a dedicated WAF or DDoS service; caching alone does not stop requests designed to miss.
Reliability works the same way. Anycast withdraws a failed site from routing, and multi-CDN setups split traffic by DNS weight so a single provider outage degrades capacity instead of removing it.
Most CDN incidents are not outages. They are traffic quietly taking the wrong path. These are the patterns worth alerting on:
Read the Cache-Status response header (RFC 9211) or your provider's equivalent cache header on a sample of requests per content class. Compute byte hit ratio from edge logs, not request hit ratio from the dashboard. Compare origin egress on your cloud bill against delivered volume: the ratio is your real miss rate. Check the Age header on manifests and installers after a publish to confirm purge behavior.
Edge compute moves request logic (authorization, personalization, manifest manipulation) into the same sites that cache bytes, which shortens round trips for dynamic responses. 5G raises per-device throughput, which mostly increases the size of video renditions requested rather than creating new traffic types. IoT adds request count far more than volume. Shorter delivery paths also cut the energy spent per byte moved, because fewer long-haul hops carry each transfer.
This blog's call: by the end of 2028, the public data on application mix will still show video above 60% of downstream internet volume, and the open debate will shift from CDN share, which is effectively saturated for cacheable content, to hit ratio on long-tail libraries and AI-generated media.
The most cited figure is a 2018-era forecast projecting that 72% of internet traffic would cross CDNs by 2022, up from 56% in 2017. No comparable public forecast has replaced it. Including the private caches run by large streaming and social platforms, the share of CDN internet traffic in 2026 is very likely above 70%, though that is an estimate.
CDNs reduce backbone load by serving repeated requests from caches close to users, so one origin fetch replaces thousands of long-haul transfers. Peering at internet exchanges and caches hosted inside ISP networks keep most bytes off paid transit. Total global internet traffic does not shrink, but the distance each byte travels does, which cuts both latency and transit cost.
Video dominates CDN traffic share because it is the largest and most cacheable traffic class: public 2022 measurements put it near 65% of downstream volume. Segments for popular titles are requested millions of times, so caches serve almost all of them. Live video adds bursty demand where request coalescing and origin shields matter more than raw edge capacity.
Byte hit ratio drives cost, because origin egress and transit bills are measured in bytes. Request hit ratio drives origin CPU, connection count and latency for small files. On mixed workloads the two can differ by ten points or more, so measure both per content class rather than relying on one blended dashboard number.
CDNs absorb many volumetric attacks because traffic spreads across many sites and the origin address stays hidden. Application-layer attacks designed to bypass cache need dedicated WAF or DDoS mitigation services. Teams commonly run a security provider for dynamic endpoints and a separate delivery CDN for large cached files, splitting traffic by hostname.
Pull seven days of edge logs and split them into content classes: video segments, manifests, installers or game builds, images and everything else. For each class compute byte hit ratio, request hit ratio and origin egress in TB, then price the gap between your current ratio and 98% using your cloud egress rate, as in the table above. The class with the largest gap is where cache key normalization, longer lifetimes on versioned paths and shield placement will pay back first.
If that analysis points at high-volume video or file delivery, the BlazingCDN features overview lists what every plan includes, from origin shield and request coalescing to Prometheus metrics for tracking the same ratios.

Heavy traffic.
Light bill.
The CDN for video and large traffic
Infrastructure
The short answer to what is IPv6: Internet Protocol version 6 is the network-layer protocol that replaces IPv4's 32-bit ...
Infrastructure
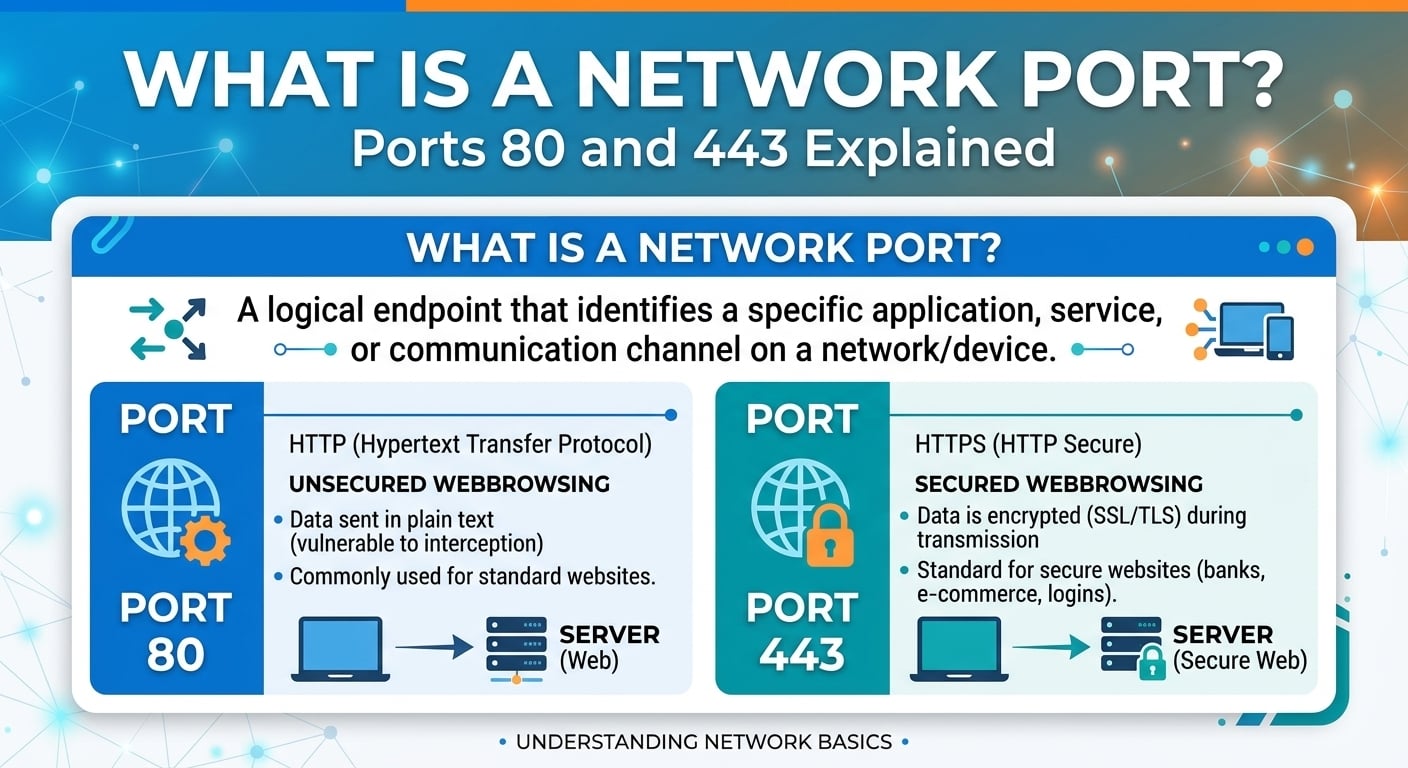
The short answer to what is a port: a network port is a 16-bit number, from 0 to 65535, carried in every TCP and UDP ...
Infrastructure
DNS propagation is the window after a record change during which recursive resolvers, operating system caches and ...

Infrastructure
DNS records are typed entries in an authoritative zone that map a name to data. An A record returns a 32-bit IPv4 ...