
Infrastructure
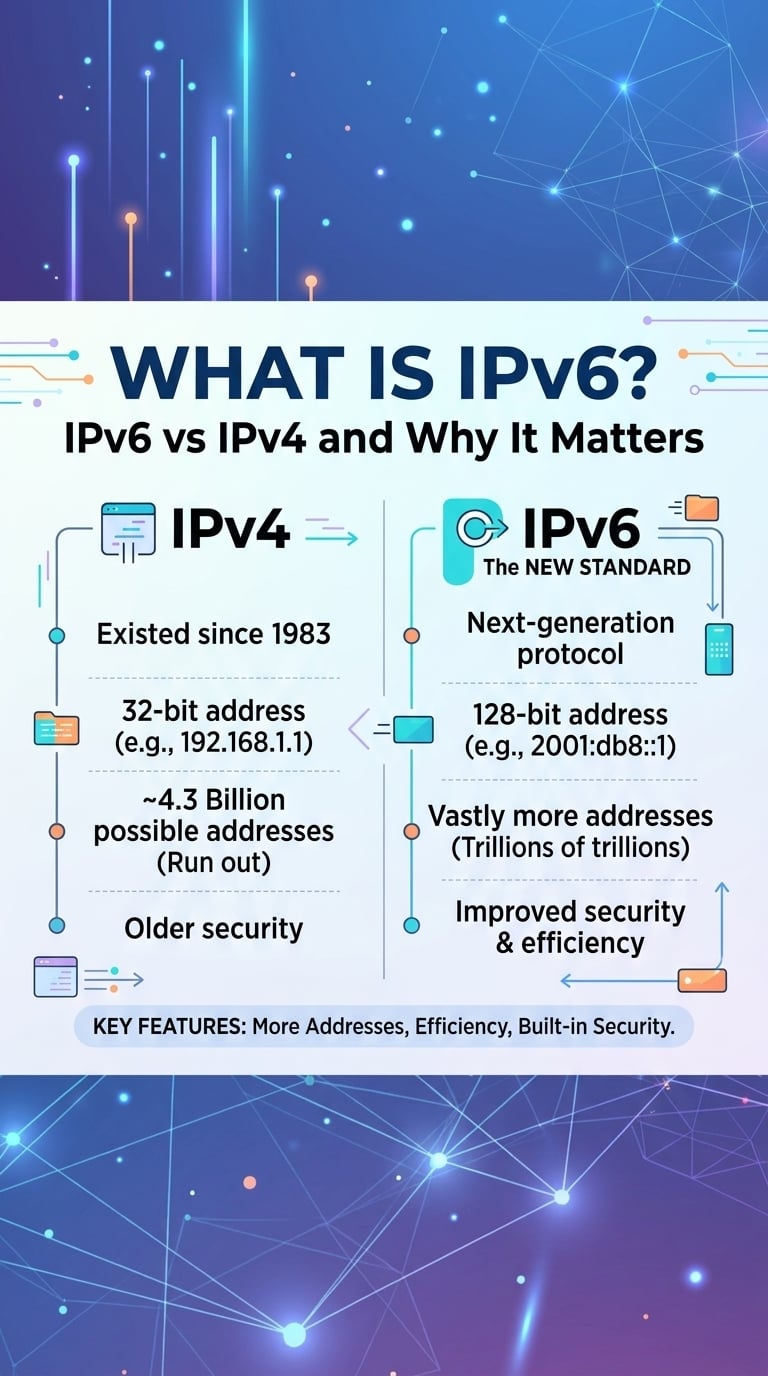
What Is IPv6? IPv6 vs IPv4 and Why It Matters
The short answer to what is IPv6: Internet Protocol version 6 is the network-layer protocol that replaces IPv4's 32-bit ...

Packet loss is the share of packets that leave a sender but never reach the receiver, and jitter is the variation in delay between packets that do arrive. The short answer to what is packet loss in practice: above roughly 1% on a sustained path, video rebuffers and calls break up, even when bandwidth looks fine. This guide covers both definitions, the causes, how to test a connection, a worked throughput calculation, a failure-mode table and fixes that work.
As of 2026, under the standard TCP Reno throughput model, a single flow with 1% packet loss and a 50 ms round-trip time tops out near 2.9 Mb/s, whatever the link capacity. That ceiling sits below a typical 1080p bitrate rung, which is why a fast connection with modest loss can still stall a video player.
Packet loss is measured as lost packets divided by packets sent over a window, usually expressed as a percentage. The ratio alone hides the pattern. Two percent loss spread evenly behaves very differently from the same 2% arriving as bursts of eight consecutive drops, because recovery mechanisms (TCP fast retransmit, QUIC loss detection, Opus in-band forward error correction) handle isolated losses well and bursts poorly.
Three properties matter when you describe loss on a production path: the average rate, the burst length distribution and the direction. Upstream and downstream loss often differ, and most quick tests report only a round-trip figure, which merges both directions into one number.
Jitter is the variation in one-way delay between consecutive packets of the same flow. If packets normally arrive 20 ms apart and some arrive after 5 ms while others take 80 ms, the path has high jitter even when the average latency looks acceptable. Real-time media suffers most, because every late packet either waits in a buffer or gets discarded.
RFC 3550 defines interarrival jitter for RTP as a smoothed mean deviation, updated with a gain of 1/16 per packet. RFC 3393 defines IP packet delay variation more generally. Operations teams usually report p95 or p99 RTT variance instead, since a smoothed mean hides the spikes that actually drain a jitter buffer.
Most loss and jitter on modern networks comes from queues. When a link is oversubscribed, packets wait in a buffer (jitter rises), and when the buffer fills, packets are dropped (loss appears). Jitter is therefore often the early warning, and loss the later symptom of the same congestion.
Packet loss vs. latency: latency is how long a packet takes, loss is whether it arrives at all. A path with 20 ms RTT can fail a live stream if loss arrives in bursts, while a 120 ms path with clean delivery streams fine with a sufficient buffer.
Jitter vs. latency: jitter is the variance of latency, not its average. Latency-only dashboards stay green while users see rebuffering, ABR downshifts and slow tail transfers, because averages absorb the spikes. Typical symptoms that latency monitoring misses:
A closer edge is not automatically a better edge. A slightly more distant server reached over clean transit can beat a nearby one reached through congested peering, because throughput depends on loss and RTT variance, not on distance alone.
The arithmetic explains why small loss rates do large damage. The TCP Reno model bounds throughput at roughly (MSS divided by RTT) multiplied by 1.22 divided by the square root of the loss rate. With a 1,460-byte MSS and 50 ms RTT, the base term is 233.6 kb/s, and the loss term does the rest.
| Loss rate | RTT | Single-flow ceiling (Reno model) | Practical effect on video |
|---|---|---|---|
| 0.01% | 50 ms | about 28.5 Mb/s | 4K ladder rungs reachable |
| 0.1% | 50 ms | about 9.0 Mb/s | 1080p holds, 4K downshifts |
| 1% | 50 ms | about 2.9 Mb/s | 720p or lower, frequent switches |
| 1% | 20 ms | about 7.1 Mb/s | shorter RTT partly offsets loss |
A tenfold increase in loss cuts the throughput ceiling by about 3.2 times, so loss matters more than raw bandwidth once it passes 0.1%.
CUBIC scales better than Reno on high bandwidth-delay paths but still backs off on every loss event. BBR estimates bottleneck bandwidth and RTT and tolerates random loss far better, yet it reacts to RTT variation, so jitter hurts it in a different way. Treat the table as an order-of-magnitude model, not a prediction for a specific stack.
Calls fail differently. ITU-T G.114 recommends keeping one-way mouth-to-ear delay under 150 ms. A jitter buffer sized at twice a 30 ms p95 jitter adds 60 ms, leaving 90 ms for network transit, encoding and decoding. Packets later than the buffer are discarded, so high jitter becomes effective loss even when the network delivered every packet.
The values below are this blog's suggested starting points, not protocol limits. Tune them by transport, content type and player buffer strategy.
| Metric | Healthy | Act when |
|---|---|---|
| RTT jitter p95 | below 15 ms | above 30 ms |
| Packet loss | below 0.3% | above 1% |
| Loss burst length | mostly single drops | more than 5 consecutive packets |
| Loaded minus idle latency | below 20 ms | above 50 ms |
| Segment fetch p99 | near baseline | twice baseline |
Burst length and loaded latency catch problems that the average loss rate reports as healthy.
A reliable packet loss test sends enough probes to measure a rate, runs both idle and under load, and checks whether loss persists to the final destination. Use a long ping of 500 to 1,000 probes, a traceroute-style tool such as mtr over a few hundred cycles, and iperf3 in UDP mode at your target bitrate to read loss and jitter directly.
Three traps produce false results. Routers deprioritize ICMP replies to themselves, so loss shown at an intermediate hop that does not continue to the last hop is rate limiting, not real loss. A 10-probe test cannot resolve 0.3% loss. And an idle test misses bufferbloat entirely: measure latency at rest, then again while saturating the download, and compare.
For a CDN or streaming service, combine three views:
Tag every sample by region, metro, ASN, protocol, object class and edge cluster. Region-only reporting hides failures that affect a single ISP.
| What breaks | How it shows up | How to confirm |
|---|---|---|
| Peak-hour peering congestion | Rebuffering in one ASN between 19:00 and 23:00 local | Loss and jitter p95 rise for that ASN only; other ISPs in the same metro stay flat |
| Access bufferbloat | Calls degrade when someone uploads or downloads | Loaded minus idle latency above 50 ms with little loss |
| UDP throttling on a network | HTTP/3 p99 transfer time worse than HTTP/2 on the same path | Split metrics by protocol per ASN; QUIC PTO counts climb |
| Bursty policer drops | Large files stall, small objects look fine | Loss bursts longer than 5 packets; retransmission timeouts instead of fast retransmits |
| Physical layer fault | Constant low-rate loss at all hours | Interface CRC and error counters increment; loss independent of load |
Correlating loss with time of day, load and protocol separates congestion from hardware faults faster than any single test.
On the user side, the fixes with the largest effect are a wired connection instead of Wi-Fi, smart queue management (fq_codel or CAKE) on the router with shaping set slightly below line rate, updated modem firmware and replaced cables. Shaping alone often cuts loaded latency from hundreds of milliseconds to under 20 ms.
On the delivery side, score each region-plus-ASN slice on latency p95, jitter, packet loss, transfer completion p99, rebuffering and cache status, then classify it:
Keep mitigations bounded and reversible: fall back from HTTP/3 to HTTP/2 for an ASN that throttles UDP, shift that ASN to a different edge pool, or lower the initial video bitrate. Require minimum sample sizes and hysteresis before changing state, otherwise routing flaps add the very jitter you are trying to remove. Applications add their own defenses: adaptive jitter buffers, forward error correction for isolated losses and conservative ABR startup.
Edge-side transport data belongs next to player RUM in the same slice dashboard. BlazingCDN, for example, delivers over HTTP/2 and TLS 1.3 on Anycast routing with built-in failover, and its CDN features for real-time statistics and Prometheus metrics make that join possible without a separate log pipeline.
A good packet loss percentage is below 0.3% for streaming and file delivery, and as close to zero as possible for calls and gaming. Above 1% sustained, most users notice stalls or audio dropouts. The burst pattern matters as much as the rate, since five or more consecutive drops defeat forward error correction and trigger TCP retransmission timeouts.
Acceptable jitter for video calls is usually below 30 ms at p95, with under 15 ms preferred. Higher jitter forces a larger jitter buffer, which adds delay against the 150 ms one-way target in ITU-T G.114. Packets arriving later than the buffer allows are discarded, so heavy jitter behaves like packet loss for real-time audio and video.
Packet loss causes buffering because loss-based congestion control cuts throughput on every drop, regardless of link speed. Under the TCP Reno model, 1% loss at 50 ms RTT caps a single flow near 2.9 Mb/s. A gigabit line with that loss rate can still deliver less than a 1080p rung, so the player downshifts or stalls.
A packet loss test with ping is accurate only with enough probes and the right interpretation. Send at least 500 probes to resolve rates near 0.3%, and ignore loss at intermediate hops that does not persist to the destination, since routers rate-limit ICMP. Ping also misses bufferbloat unless repeated while the connection is saturated.
A CDN reduces packet loss and jitter by shortening the path and avoiding congested interconnects, but it cannot fix a viewer's Wi-Fi or access link. The gain is largest when edge selection uses loss and jitter per ASN rather than distance alone, because a nearby edge behind congested peering can perform worse than a farther, cleaner one.
For your top five countries and top ten ASNs, chart RTT p95, jitter p95, packet loss and segment fetch p99 over seven days, then overlay rebuffer ratio or large-object completion time. Split every series by protocol and by peak versus off-peak hours. If those lines tell different stories, latency-only monitoring is hiding the problem, and the failure-mode table above tells you which cause to confirm first.
To compare a delivery path against your current one, BlazingCDN publishes its measured transfer figures and a public test file on the BlazingCDN performance metrics page, which you can run from the same probes and ASNs.

Heavy traffic.
Light bill.
The CDN for video and large traffic
Infrastructure
The short answer to what is IPv6: Internet Protocol version 6 is the network-layer protocol that replaces IPv4's 32-bit ...
Infrastructure
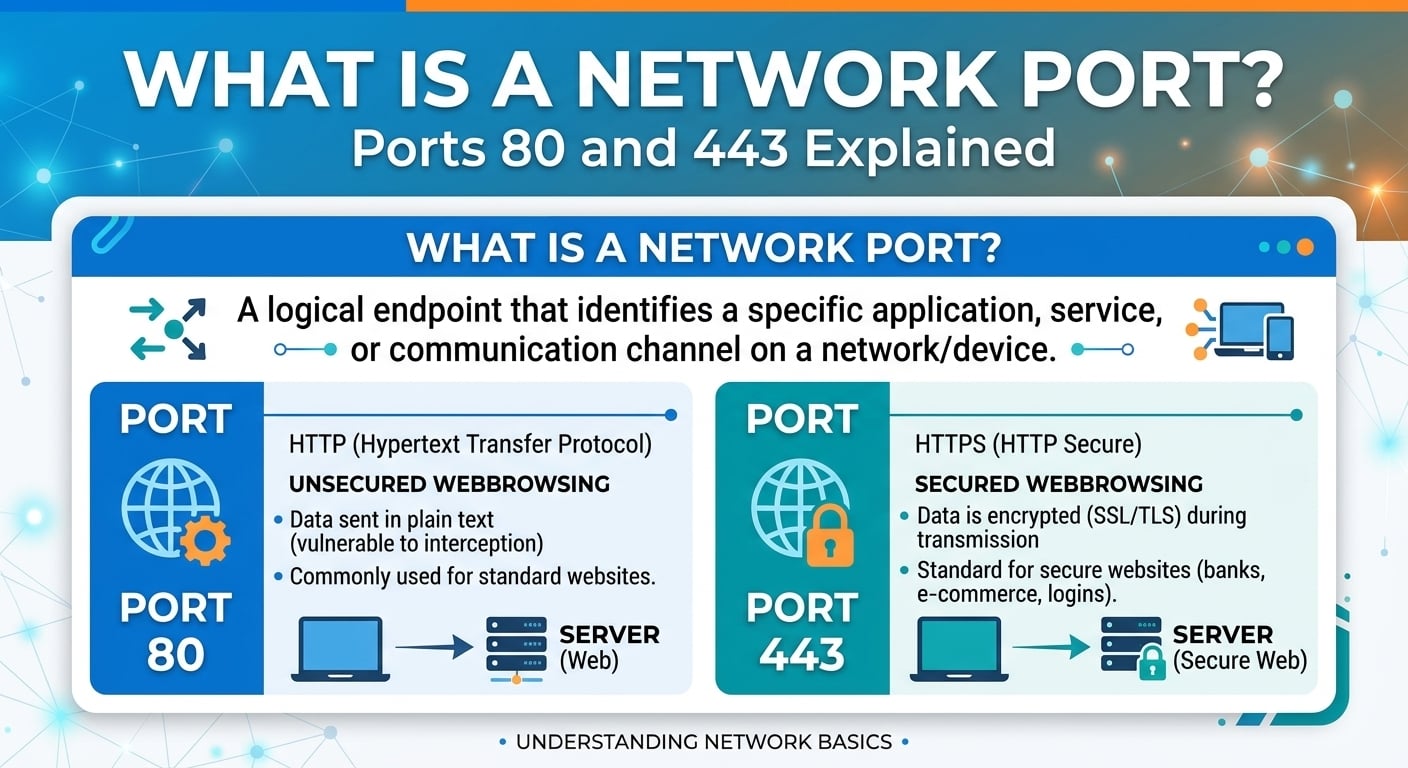
The short answer to what is a port: a network port is a 16-bit number, from 0 to 65535, carried in every TCP and UDP ...
Infrastructure
DNS propagation is the window after a record change during which recursive resolvers, operating system caches and ...

Infrastructure
DNS records are typed entries in an authoritative zone that map a name to data. An A record returns a 32-bit IPv4 ...