
Learn
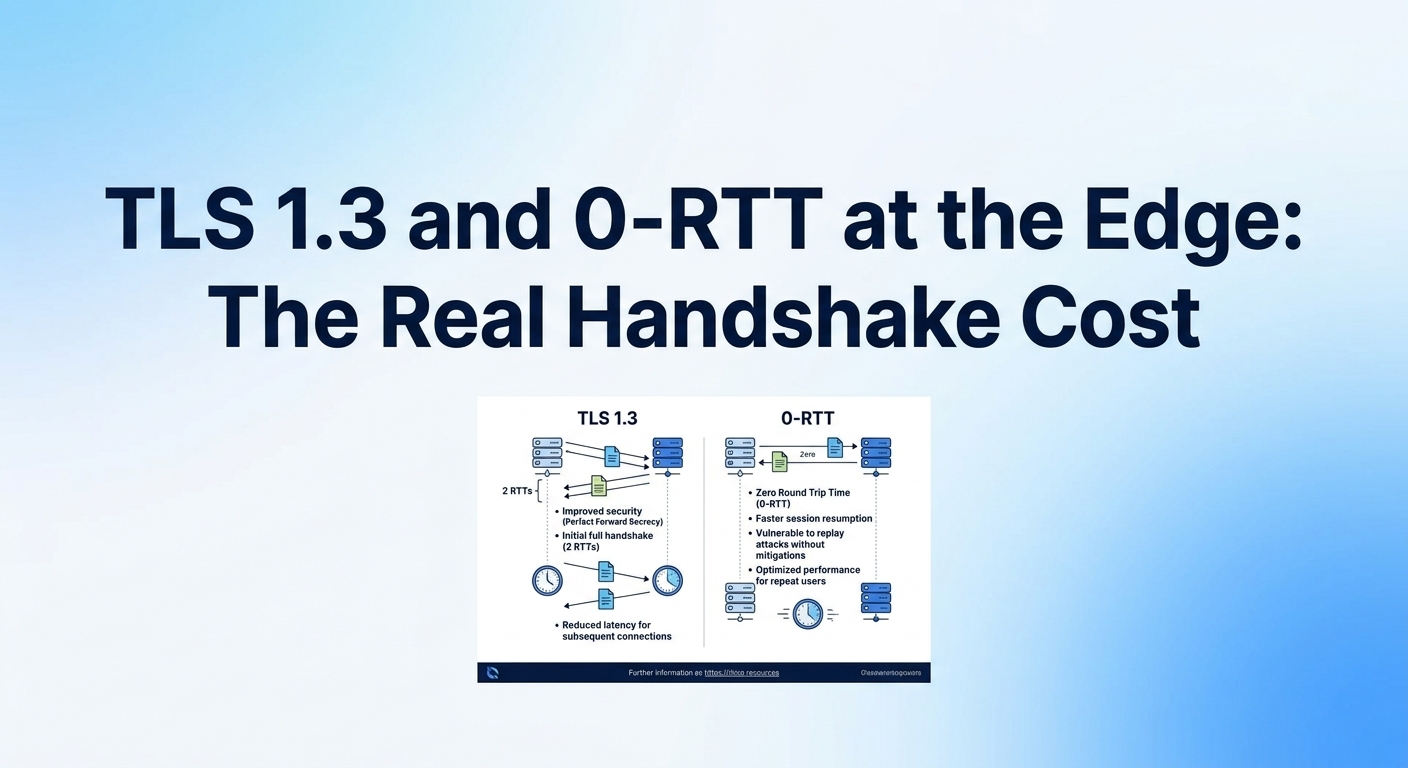
TLS 1.3 and 0-RTT at the Edge: The Real Handshake Cost
TLS 1.3 removes exactly one round trip from a full handshake compared with TLS 1.2, and 0-RTT removes one more on ...
This playbook produces a defensible CDN latency test in about 45 minutes of hands-on work: connection phases split into DNS, TCP, TLS and time-to-first-byte, measured from five regions, segmented by cache hit and cache miss, and reported as p50/p95/p99 instead of an average. Budget roughly 1,000 samples per region per segment if you want a p99 you can defend in a design review. In 2026 measurements, within-region cache hits typically land at 15–45 ms TTFB and cache misses at 80–300 ms. A single blended number sitting between those two ranges tells you nothing useful.
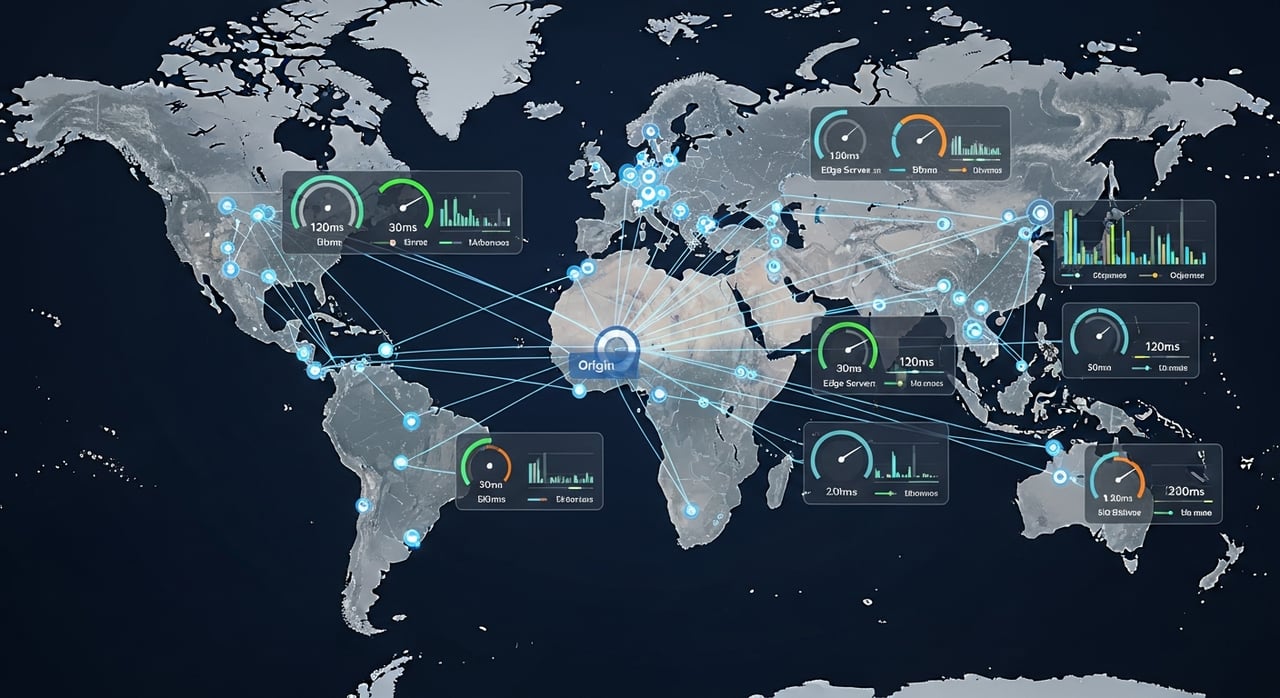
Most latency numbers people quote are unreproducible because two runs differed in something nobody wrote down. Fix these five axes before the first request goes out, and record them next to every result:
Without origin-side timing you cannot tell whether a slow miss is edge-to-origin network time or your own application. Add a log format that captures upstream time and cache status, and emit Timing-Allow-Origin so browser Resource Timing later gives you the same phase breakdown for real users.
log_format cdnbench '$remote_addr $host "$request" '
                    'status=$status bytes=$body_bytes_sent '
                    'req_time=$request_time upstream_time=$upstream_response_time '
                    'proto=$server_protocol tls=$ssl_protocol '
                    'cache=$upstream_cache_status';

server {
    listen 443 ssl;
    http2 on;
    server_name ORIGIN_HOST;
    access_log /var/log/nginx/cdnbench.log cdnbench;

    location /bench/ {
        add_header Cache-Control "public, max-age=300" always;
        add_header Timing-Allow-Origin "*" always;
        add_header X-Origin-Node ORIGIN_HOST always;
    }
}
Replace ORIGIN_HOST with your origin hostname. Keep max-age short enough that you can force fresh misses without purging.
Resolve the hostname from each vantage point and check which address family and which route you actually get. A "slow region" is frequently a DNS answer pointing somewhere unexpected, or an IPv6 path with a different transit mix.
dig +noall +answer TEST_HOST A
dig +noall +answer TEST_HOST AAAA
mtr --report --report-cycles 100 --tcp --port 443 TEST_HOST
Substitute TEST_HOST with your CDN hostname. Record the resolved address per region in your results file; if it changes mid-run, your samples are not comparable.
Two k6 scenarios, one hitting a cacheable path and one generating guaranteed misses through unique path segments. Path-based cache busting avoids query strings, which some configurations strip or ignore.
import http from 'k6/http';
import { check } from 'k6';

export const options = {
  scenarios: {
    hit: {
      executor: 'constant-arrival-rate',
      rate: 4, timeUnit: '1s', duration: '10m',
      preAllocatedVUs: 20, exec: 'cacheHit'
    },
    miss: {
      executor: 'constant-arrival-rate',
      rate: 2, timeUnit: '1s', duration: '10m',
      preAllocatedVUs: 20, exec: 'cacheMiss'
    }
  },
  discardResponseBodies: false
};

const BASE = 'https://TEST_HOST';

export function cacheHit() {
  const res = http.get(BASE + '/bench/static/asset-256k.bin', { tags: { seg: 'hit' } });
  check(res, { 'served': function (r) { return r.status === 200; } });
}

export function cacheMiss() {
  const unique = Date.now().toString() + '-' + __VU.toString();
  const res = http.get(BASE + '/bench/uncached/' + unique + '/asset-256k.bin', { tags: { seg: 'miss' } });
  check(res, { 'served': function (r) { return r.status === 200; } });
}
Replace TEST_HOST with your CDN hostname. That run yields 2,400 hit samples and 1,200 miss samples per region. Read four metrics from the summary: http_req_connecting (TCP), http_req_tls_handshaking (TLS), http_req_waiting (TTFB, the number most people mean by latency), and http_req_receiving (transfer).
For throughput, add a third scenario using the per-VU-iterations executor with one virtual user and 20 iterations against the 100 MB object, then compute megabits per second from body size divided by http_req_receiving. Run it after the latency scenarios, never concurrently — a saturated uplink corrupts both.
Use n = k / (1 − p), where k is the number of samples you want above the percentile. With k = 10, p95 needs 200 samples and p99 needs 1,000 — enough to report, not enough to be precise. With k = 100, p95 needs 2,000 and p99 needs 10,000. Anything below k = 10 is a single unlucky TCP retransmit away from a fictional result.
Compare your output against these reference ranges, gathered from public 2025–2026 measurements across cloud vantage points. They are ranges, not targets, and they assume HTTP/2 with connection reuse.
| Segment | p50 TTFB | p95 TTFB | Investigate if |
|---|---|---|---|
| Cache hit, same continent | 15–45 ms | 40–90 ms | p95 exceeds 3x p50 |
| Cache hit, cross-continent | 25–70 ms | 60–150 ms | p50 above 100 ms |
| Cache miss to origin | 80–300 ms | 200–600 ms | upstream_time is most of it |
| TLS 1.3 handshake, cold | 1 RTT + 5–15 ms | 2 RTT | consistently above 2 RTT |
| Single-connection throughput, 100 MB | 150–600 Mbps | n/a | flat regardless of distance |
The single most useful signal in this table is the ratio between p95 and p50 on cache hits: anything above 3x points at edge contention or an unstable path, not at distance.
A cache-hit test and a cache-miss test measure two different systems. In 2026 measurements, an edge cache hit typically returns first byte in 15–45 ms within-region while a miss that traverses to origin adds 80–300 ms, so blending the two into one average commonly understates p95 by a factor of 2 to 5. Segment on the Cache-Status response header defined in RFC 9211 before you compute any percentile.
Three more corrections that separate a real latency benchmark from a screenshot:
| Symptom | Likely cause | Fix |
|---|---|---|
| Miss scenario shows hit latency | Path normalization collapsing unique segments | Verify Cache-Status per response; move the unique token into the filename |
| p99 spikes every run at the same clock minute | Cron or log rotation on the load generator | Move the VM off shared schedulers; re-run and compare |
| TLS time near zero for all samples | Connection reuse across iterations | Disable reuse for a first-view run, keep it on for steady-state |
| One region 200 ms worse, path looks fine | DNS steering to a distant answer | Compare resolved addresses across regions and resolvers |
| Throughput caps at exactly 1 Gbps | Load generator NIC, not the CDN | Check instance network tier before recording the result |
Four of these five failures live on your side of the wire, which is why every anomalous result deserves a path and DNS check before a support ticket.
Stop the arrival-rate scenarios first — an abandoned 10-minute run left in a loop is the most common surprise egress line item after a benchmark week. Purge the /bench/uncached/ prefix so junk objects do not occupy edge storage, remove the extra log_format if your log pipeline parses strictly, and archive the raw k6 JSON summaries with the resolved addresses and timestamps. Without those, next quarter's run is not a comparison.
Once the numbers stabilize, cut the duration to 3 minutes, drop the miss rate to 1 request per second, and schedule it hourly from two regions with a threshold on http_req_waiting p95. That is roughly 400 MB of egress per region per day and gives you a trend line instead of an anecdote.
When you re-run against a candidate provider, keep the object set, region list and protocol identical. Providers with fast onboarding make same-week A/B testing realistic — BlazingCDN, for example, provisions in about an hour and serves from NVMe SSD edge storage, which mainly shows up in your data as flatter p95 on large-object hits. If you are comparing designs rather than vendors, the reference material on custom enterprise CDN infrastructure covers the origin shield and storage variables that move miss latency.
Run the same load script from small VMs in at least five geographically separated regions, resolving the CDN hostname locally in each one. Identical object sets, identical protocol, identical duration. Record the resolved IP address per region, because DNS steering differences explain more cross-region variance than physical distance does.
No. ICMP round-trip time measures network path latency only and ignores TLS handshake, cache lookup, origin fetch and transfer. Ping is useful as a lower bound and for detecting routing changes, but a CDN latency test must measure time-to-first-byte over HTTPS, segmented by cache status, to reflect what users experience.
For a cache hit measured from a cloud vantage point on the same continent, 15–45 ms at p50 and under 90 ms at p95 is typical in 2026. Cross-continent hits run 25–70 ms at p50. Real-user numbers from residential and mobile networks usually add 10–30 ms on top of these figures.
Roughly 1,000 samples per segment per region for a reportable p99, and about 10,000 for a tight confidence interval. The rule is n = k / (1 − p), where k is the count of samples above the percentile; k below 10 makes the result hostage to a single retransmit or garbage collection pause.
Test both, in separate runs, and never mix them in one percentile. HTTP/3 per RFC 9000 typically wins on lossy or high-RTT paths by removing head-of-line blocking and saving a round trip on resumption, while HTTP/2 over TCP often matches or beats it on clean, low-latency wired paths.
Take one afternoon, stage the two objects, and run the hit and miss scenarios from three regions. Then post one number to your team channel: the p95-to-p50 ratio on cache hits, per region. If it is under 2.5, your edge tier is healthy and any user complaints are coming from origin or client code. If it is above 3, you have edge variance worth chasing before anyone opens a vendor conversation. Either way you now have a baseline that a future migration or config change can be measured against.

Heavy traffic.
Light bill.
The CDN for video and large traffic
Learn
TLS 1.3 removes exactly one round trip from a full handshake compared with TLS 1.2, and 0-RTT removes one more on ...
Learn
Evaluated February 2026. Two mechanisms decide which edge serves a request, and they fail on completely different ...

Security
Cloudflare Rate Limiting Pricing 2026: Plans, Rules, Real Costs Cloudflare rate limiting pricing has one detail that ...