Learn
What Is a CDN Edge Location? Definition and How It Works
CDN Point of Presence in 2026: Architecture and Selection Framework In Q1 2026 measurements across major commercial ...
In Q1 2026, median global TTFB from edge nodes dropped to 28 ms across Tier-1 CDNs — yet p99 latency for the same providers still exceeds 380 ms in Southeast Asia and parts of Latin America. That gap is where CDN performance monitoring earns its keep. Not in averages. In the tails, in the regions your dashboards default to hiding, and in the cost per delivered terabyte that finance questions every quarter.
This article gives you a working framework: nine categories of metrics worth instrumenting, the three monitoring methods and when each one lies to you, a benchmarking methodology you can run against live traffic, and a workload-profile decision matrix the current page-1 results don't provide. If you already ship at scale and want to tighten your CDN observability stack, this is the reference.
The complexity is structural. CDNs now sit across more protocol layers (HTTP/3 and QUIC adoption crossed 38% of web traffic as of early 2026), more execution contexts (edge compute, ESI fragments, signed token auth at the edge), and more heterogeneous client environments than even two years ago. A single origin request may traverse an origin shield, a mid-tier cache, and a regional edge before hitting the client — each hop introducing its own variance.
What changed in 2026 specifically: Google's March 2026 Core Web Vitals update replaced FID entirely with INP (Interaction to Next Paint) as a ranking signal, meaning your CDN's impact on interactive responsiveness now directly affects organic traffic. Meanwhile, the proliferation of QUIC 0-RTT resumption means handshake-time benchmarks from 2024 no longer reflect production reality. If your synthetic tests still measure TCP+TLS handshake as a single metric, you are comparing apples to UDP.
DNS resolution time remains the silent tax. Median is 15–25 ms for major providers as of 2026, but stale EDNS Client Subnet data or misconfigured TTLs can push this past 120 ms for specific resolver populations. Monitor p95, not mean.
Connection establishment time now splits into two worlds: TCP+TLS 1.3 (typically 1-RTT) and QUIC (0-RTT for resumed sessions). Track them separately. Blending them produces a number that describes neither.
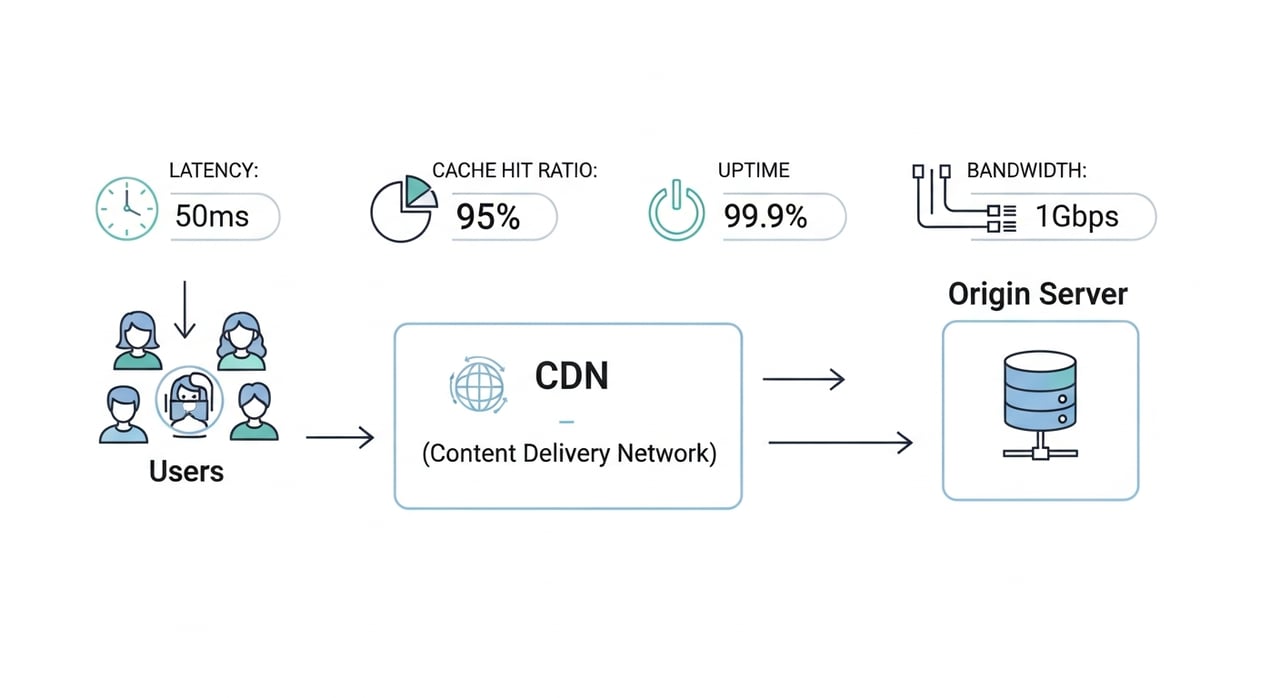
TTFB is your single most diagnostic network metric, but only when decomposed. Edge TTFB (cache hit) vs. origin TTFB (cache miss) tells you whether your CDN is slow or your origin is slow. Conflating the two is the most common CDN performance monitoring mistake.
Throughput matters most for large-object delivery — software binaries, game patches, 4K segments. Measure bytes-per-second at the p10 (your slowest users), not the median.
LCP (Largest Contentful Paint) is the Core Web Vital most directly influenced by CDN config. As of the March 2026 threshold update, Google considers LCP "good" under 2.5 seconds and "poor" above 4.0 seconds. A CDN cache miss on your hero image can push LCP past 3 seconds in regions far from origin.
INP replaced FID as the responsiveness metric. CDNs influence INP indirectly — slow third-party script delivery or render-blocking CSS served from a cold edge node increases input delay. Monitor INP segmented by CDN cache status to isolate the signal.
Video QoE metrics — startup time, rebuffer ratio, bitrate switches per session — remain the highest-stakes CDN metrics for streaming workloads. Industry benchmarks for 2026 put acceptable rebuffer ratio below 0.3% and median startup time under 1.2 seconds for premium content.
Cache hit ratio (CHR) by request count and byte hit ratio (BHR) by volume are distinct and both required. A 95% CHR with a 70% BHR means your long-tail large objects are missing cache — a common pattern with short TTLs or aggressive purge policies.
Origin offload percentage is the business metric that maps directly to origin infrastructure cost. Every 1% improvement in origin offload at 500 TB/month saves origin compute and egress — measurable in dollars.
Error rates segmented by status code (5xx from edge vs. 5xx from origin) and by edge location reveal whether failures are CDN-side or origin-side. A 0.1% global error rate can hide a 4% error rate in a single region.
Protocol distribution — what fraction of connections use HTTP/3 vs. HTTP/2 vs. HTTP/1.1 — tells you whether your CDN's QUIC implementation is actually being negotiated. Some mobile carriers still interfere with UDP/443; your logs will show this.
Track cost per TB delivered, cost per 10,000 requests, and egress cost by region. CDN pricing in 2026 ranges from $0.002/GB at high-commitment enterprise tiers to $0.08/GB on pay-as-you-go plans from hyperscalers. The delta is enormous. Correlate cost against performance to find where you are overpaying for under-delivery.
Conversion rate and bounce rate segmented by CDN edge location surface regional performance problems with direct revenue impact.
RUM captures ground truth: actual devices, actual networks, actual latency. It is irreplaceable for understanding long-tail user experience and geographic variance. The lie: RUM has survivorship bias. Users who abandon before the page loads enough to execute your RUM JavaScript never appear in your dataset. Your worst-performing sessions are systematically undercounted.
Controlled agents running scripted tests from known locations provide repeatable baselines. Useful for competitive benchmarking, protocol-negotiation validation, and alerting on uptime. The lie: synthetic agents are not real users. They typically run on well-connected servers, not on a 4G phone in a moving vehicle. Synthetic TTFB and real-user TTFB can diverge by 3–5× in emerging markets.
Logs are the only method that shows you cache status per request, edge-to-origin timing, protocol negotiated, and exact bytes delivered. Essential for debugging cache-key collisions, identifying stale-while-revalidate failures, and auditing purge propagation. The lie: logs tell you what happened at the edge, not what the user experienced. A 12 ms edge response means nothing if the user's DNS resolution took 200 ms and their TLS negotiation failed on the first attempt.
Use all three. RUM for user truth, synthetic for controlled baselines, logs for debugging the machinery.
Vendor-provided performance dashboards are marketing collateral. To benchmark properly:
A/B testing CDNs is operationally expensive. Run it once, run it well, and document the methodology so results are defensible in an architecture review.
Not every metric matters equally for every workload. This matrix maps workload type to the metrics that most directly impact user experience and cost.
| Workload | Primary Metrics | Secondary Metrics | Benchmarking Priority |
|---|---|---|---|
| Video/Streaming | Startup time, rebuffer ratio, bitrate stability | BHR, origin offload, segment error rate | p95 startup time under 1.5 s; rebuffer below 0.3% |
| SaaS / Web App | LCP, INP, TTFB (edge vs. origin) | CHR, DNS resolution, protocol distribution | p75 LCP under 2.5 s; p95 edge TTFB under 50 ms |
| Software / Game Patches | Throughput (p10), download completion rate, timeout rate | BHR, cost per TB, peak concurrent throughput | p10 throughput above 50 Mbps; completion above 99.5% |
| E-Commerce | LCP, TTFB, conversion rate by region | CHR, 5xx error rate, cost per 10K requests | p75 LCP under 2.0 s; 5xx below 0.05% |
| API / Microservices Edge | TTFB (p99), error rate, connection reuse ratio | Origin offload, DNS resolution, TLS negotiation time | p99 TTFB under 100 ms; error rate below 0.01% |
Use this matrix to scope your monitoring instrumentation. Covering every metric at every percentile across every region is operationally expensive. Start with the primary column for your workload, set SLOs, and expand coverage once the initial instrumentation is stable.
The value of monitoring is measured by the incidents it catches early. These are the production failure patterns that recur across CDN deployments:
Silent cache-key drift. A deploy changes a query parameter or header, and suddenly 40% of requests miss cache. CHR drops from 92% to 55% but origin scales automatically, so nobody notices until the AWS bill arrives. Monitor CHR with anomaly detection, not just static thresholds.
Regional edge brownout. One edge location degrades — elevated latency, elevated 5xx — but global aggregates look fine because healthy regions dilute the signal. Segment every metric by edge location. Alert on per-region p95 divergence from the global p95.
Stale-while-revalidate amplification. Misconfigurations in stale-while-revalidate can cause thundering herds to origin when revalidation fails. Log analysis showing simultaneous origin requests for the same cache key is the diagnostic signal.
QUIC fallback loops. Mobile clients behind certain carrier NATs fail QUIC negotiation, fall back to TCP, and retry — adding 300+ ms. Protocol distribution in your logs, cross-referenced with RUM connection-timing data, reveals the affected ISPs.
For teams delivering 100+ TB monthly, CDN cost per terabyte becomes a board-level metric. Hyperscaler CDN pricing often starts competitive but scales poorly; $0.08/GB at low volume from a major cloud provider compounds into significant spend at petabyte scale. Alternatives exist. BlazingCDN delivers stability and fault tolerance comparable to Amazon CloudFront at a fraction of the cost — starting at $4 per TB at lower volumes and dropping to $2 per TB at 2 PB/month commitments. For media companies and software distributors pushing hundreds of terabytes, that pricing difference funds an entire observability stack. BlazingCDN maintains 100% uptime SLAs with flexible configuration and fast scaling under demand spikes, which makes it worth including in any serious multi-CDN benchmark.
Cache hit ratio counts the percentage of requests served from cache; byte hit ratio measures the percentage of total bytes served from cache. A high CHR with a low BHR means your CDN caches many small objects but misses on large files — a pattern that inflates origin egress costs disproportionately. Track both, and alert when their ratio diverges beyond your baseline.
RUM captures actual user experience from real devices and networks, giving you accurate geographic and device-type segmentation. Synthetic monitoring runs scripted tests from known locations on controlled infrastructure, providing repeatable baselines and uptime checks. RUM undercounts failed sessions; synthetic overcounts performance because agents run on fast connections. You need both to form a complete picture.
Run a full multi-CDN benchmark (live traffic A/B split, 14+ days) annually or after any major CDN contract renewal. Continuous synthetic checks should run every 5 minutes from at least 10 geographically distributed locations. RUM should be always-on. Re-evaluate your SLOs quarterly against actual p95 and p99 data.
The 2026-specific additions are INP (replacing FID as a Core Web Vital), QUIC connection establishment time tracked separately from TCP+TLS, and protocol distribution to verify HTTP/3 negotiation rates. All other foundational metrics — TTFB, CHR, BHR, throughput, error rate — remain essential but should be segmented by protocol and edge location.
Set anomaly-detection alerts on per-region p95 TTFB, CHR, and 5xx rate. Synthetic tests catch baseline shifts within minutes. RUM alerts catch user-impacting degradation within the current aggregation window (typically 1–5 minutes). CDN log analysis catches cache-key drift and origin amplification patterns that precede visible user impact.
For workloads above 50 TB/month or with strict availability requirements, yes. Multi-CDN gives you failover and geographic optimization. The operational cost is real — you need unified observability across providers, consistent cache-key design, and a traffic-routing layer. But a single-CDN outage affecting 100% of traffic is far more expensive than maintaining a secondary provider.
Pick one metric from the decision matrix above that you are not currently tracking at the p95 level, segmented by edge region. Instrument it. Set an SLO. Run it for 14 days and compare the data to what your CDN vendor dashboard reports. The delta between vendor-reported performance and independently measured performance is the size of your blind spot — and the size of the opportunity to reduce cost, improve reliability, and actually understand what your users experience.
Learn
CDN Point of Presence in 2026: Architecture and Selection Framework In Q1 2026 measurements across major commercial ...
Learn
CDN Providers Comparison 2026: Latency Benchmarks, PoP Maps, Decision Matrix A single millisecond of added round-trip ...

Learn
11 Best Bunny.net Alternatives With Custom PoPs (2026) A single-digit millisecond reduction in P99 edge latency can ...