

Learn
What Is H.264 (AVC)? The Codec Behind Most Online Video
H.264, also called Advanced Video Coding (AVC) or MPEG-4 Part 10, is a block-based video compression standard published ...
The same terabyte of egress can cost a CDN somewhere between $0.20 and $12 to deliver, and almost all of that variance comes from one thing: the ratio of peered traffic to purchased transit. CDN peering at an internet exchange turns bandwidth into a fixed port cost that gets cheaper the more you push through it, while IP transit stays a per-Mbps variable cost that is billed at the 95th percentile. As of 2026, wholesale transit in a hub market like Frankfurt or Ashburn clears around $0.05–$0.25 per Mbps per month at 10G-plus commits (estimate, based on publicly reported ranges); in São Paulo, Mumbai, Lagos or Sydney the same capacity commonly costs 3–10x that. Your vendor's $/TB is that mix, plus margin.
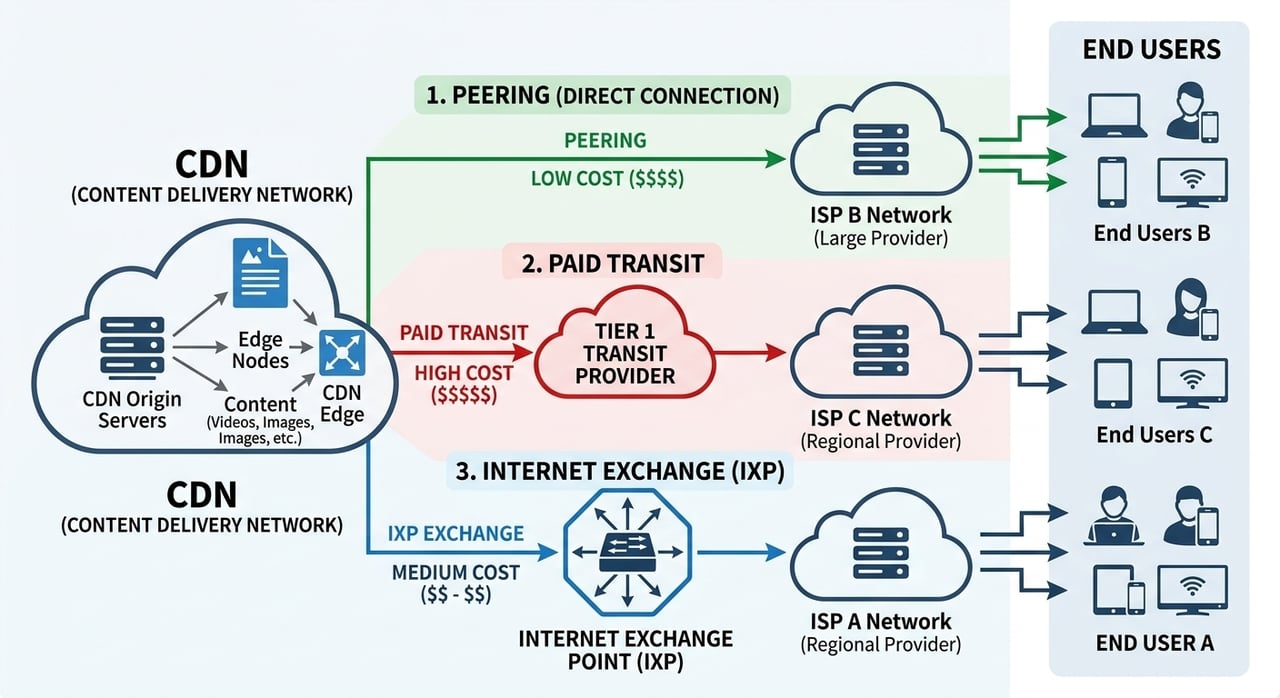
A CDN sells you delivered bytes. Its own cost for those bytes is not a per-GB number at all: it is a portfolio of fixed IX port fees, transit commits with overage, colocation and power, hardware amortization, and paid peering agreements. When a vendor quotes you a flat $/TB, they are averaging that portfolio and betting on your traffic distribution matching their strong regions.
Key numbers worth repeating in a budget meeting:
Assumptions stated inline: $0.10 per Mbps per month transit price, 95th percentile billing, peak-to-average ratio of 2.5, hub market, no origin cache-fill included.
At perfect 100% utilization, $0.10 per Mbps buys 324 GB, or $0.31 per TB. Real traffic peaks, so you bill 2.5x your average: effective transit cost rises to roughly $0.77 per TB. Add cache-fill from origin, colocation and power, server amortization over three years, IPv4 and monitoring, plus support headcount, and a transit-only delivery floor in a cheap market lands near $1.20–$1.80 per TB (estimate). Run the same model in a market where transit is $0.60 per Mbps and the floor moves past $5 per TB.
Internet exchange peering replaces that variable rate with a fixed port. A 100GE port plus cross-connect and membership at roughly $2,000 per month, running 30 Gbps average, carries about 9,720 TB in a month — call it $0.21 per TB. Load the same port to 10 Gbps average and the number triples to $0.62 per TB. Peering economics are entirely a utilization game, which is why a vendor's port count matters less than its port fill.
Two caveats keep this honest. Peering only helps for traffic whose destination network is actually present at that exchange and willing to accept your routes; the rest falls back to transit. And peering-heavy networks carry fixed cost through traffic troughs, which is why they push volume commitments rather than pure on-demand pricing.
| Network mix | Est. cost per delivered TB (2026) | What it means for your price |
|---|---|---|
| 70–90% peered, well-filled IX ports, caches inside access networks | $0.30–$0.60 | Can quote $2–$5/TB at volume and still hold margin |
| 40–60% peered, transit for the tail | $0.80–$1.30 | Volume discounts flatten out fast below $8/TB |
| Transit-only, rented or resold capacity | $1.50–$3.00 | Cheap headline rates usually come with tight commit terms |
| High-cost region, transit-only | $5.00–$15.00 | Explains regional rate cards and surcharge zones |
All figures are modelled estimates from public transit and IX port price ranges, not vendor disclosures; the single conclusion is that any CDN quoting under about $5 per TB globally is necessarily peering-heavy, because transit-only economics cannot reach that number.
| Criterion | Question to ask | Answer that should worry you |
|---|---|---|
| Peered share | What percentage of traffic to my top five destination networks is settlement-free? | No figure, or a global average instead of per-network data |
| Port headroom | Peak utilization on the exchange ports serving my audience regions? | Sustained above 70% at peak with no upgrade date |
| Transit diversity | How many independent upstreams per region, and is any capacity resold? | Single upstream in a region you depend on |
| Pricing structure | Volume tiers or per-region rate card, and how are surcharge zones defined? | Zones that can be redefined unilaterally mid-term |
| Spike behaviour | What happens to billing and routing at 5x normal peak for six hours? | Burst priced at list, or silent failover to a partner network |
The most predictive of these is per-network peered share for your actual audience, because it determines both the vendor's cost floor and the number of transit hops between your bytes and your users.
Regional rate cards are the main lock-in mechanism in CDN network economics. A contract negotiated when 80% of your traffic was North American becomes expensive the moment product-market fit appears in Brazil or Indonesia, and renegotiating mid-term rarely goes your way. Model the invoice against next year's traffic map, not last year's.
Switching cost itself is modest for cacheable traffic: DNS-based cutover, a warm-up period where origin egress rises for 24–72 hours, and re-testing signed URLs, cache keys and purge tooling. Budget engineering time, not migration fees. Running two CDNs behind weighted DNS is the cheapest insurance available and also your only honest benchmark.
BlazingCDN prices delivery on progressive volume tiers rather than per-region rate cards: as of October 2026, pricing starts at $5 per TB and runs down to $2.50 per TB at volume, with one rate for the US, Europe and Asia. The platform offers Anycast routing with built-in failover and flexible configuration, while sitting in the cost-at-scale league alongside vendors like Bunny.net, CDN77 and Gcore. The honest limitation: below roughly 5 TB per month the $25 monthly minimum applies, and if your audience is concentrated in one cheap hub region, a deeply negotiated regional commit elsewhere may beat a flat rate. Compare the tiers against your own traffic map on the CDN bandwidth pricing page.
Peering is a direct traffic exchange between two networks, usually settlement-free, paid for as a fixed port and cross-connect. IP transit is purchased access to the rest of the internet, billed per Mbps at the 95th percentile. Peering cost per TB falls as utilization rises; transit cost per TB stays roughly constant.
Because underlying transit, colocation and power costs differ by region, often by 3–10x between a European hub and markets in South America, Africa, South Asia or Oceania. Vendors either pass this through as surcharge zones or blend it into one global rate and accept thinner margin on expensive regions.
Internet exchange peering moves traffic off metered transit onto a fixed-cost port. At $2,000 per month for a 100GE port carrying 30 Gbps average, marginal cost is about $0.21 per TB versus roughly $0.77 per TB for transit at $0.10 per Mbps with a 2.5 peak-to-average ratio (2026 estimates).
No. Price differences frequently reflect margin targets, sales overhead and feature scope rather than network quality. A cost-focused vendor with well-filled exchange ports in your audience regions can outperform a premium vendor whose strength lies elsewhere. Verify with per-region latency and throughput tests against your own users.
Ask for peered share against your top destination networks, not a global figure. Mature content networks describe 60–90% of traffic leaving via peering or embedded caches. A vendor unwilling to give any per-region breakdown is usually reselling capacity rather than operating its own interconnection.
This week, pull your last 90 days of delivered bytes and group them by destination autonomous system, not by continent. Take the top ten networks — that is usually 60–75% of your volume — and send that exact list to every CDN in your evaluation with one question: what share of traffic to these ten networks is settlement-free, and what is your peak port utilization serving them? Then divide your current invoice by delivered TB and compare it against the $0.30–$1.30 cost bands above. The gap is your negotiating room.

Heavy traffic.
Light bill.
The CDN for video and large traffic
Learn
H.264, also called Advanced Video Coding (AVC) or MPEG-4 Part 10, is a block-based video compression standard published ...
Compare
At 100 TB a month, the published price gap between options for a CDN for static content is more than 16 times: ...
Learn
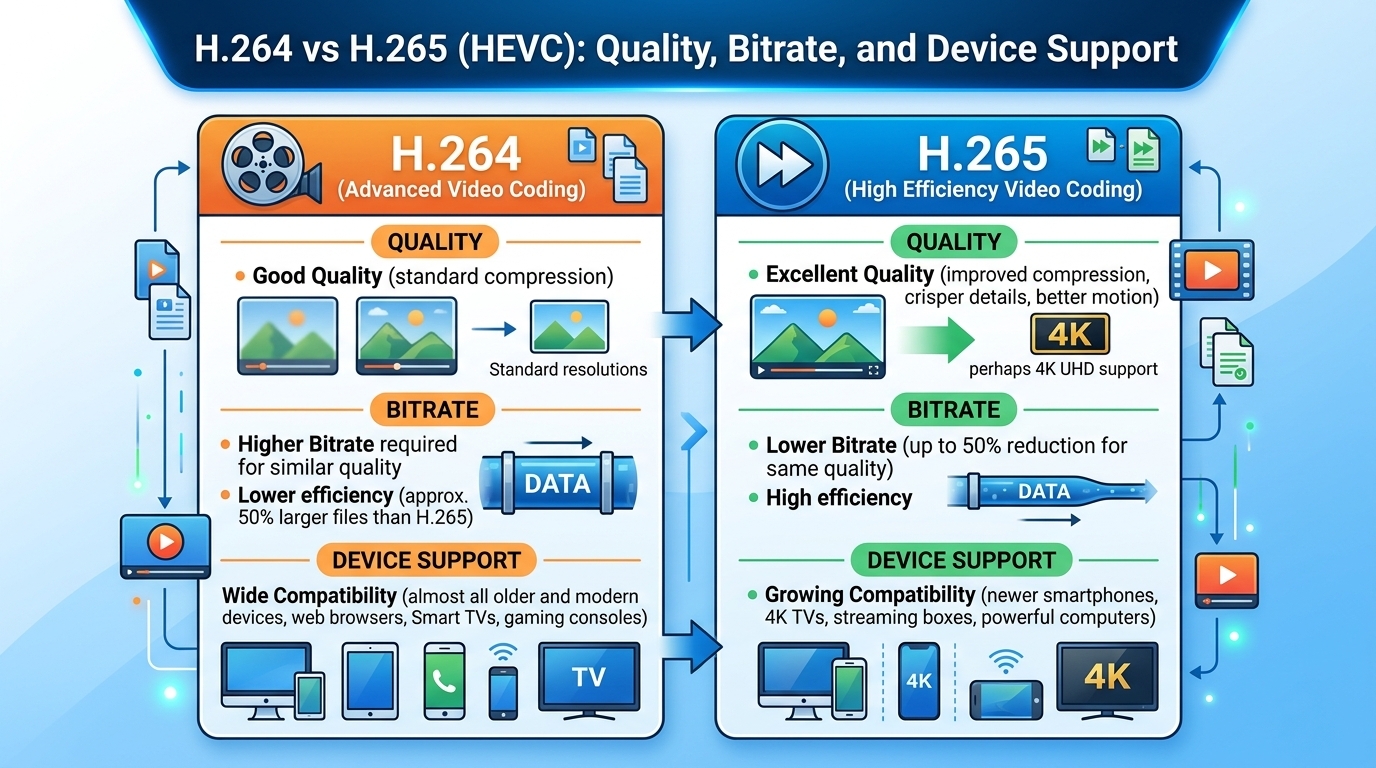
Evaluated October 2026: in the h264 vs h265 decision, HEVC (H.265) matches H.264 (AVC) quality at roughly 30 to 50 ...