Video - Video & Streaming
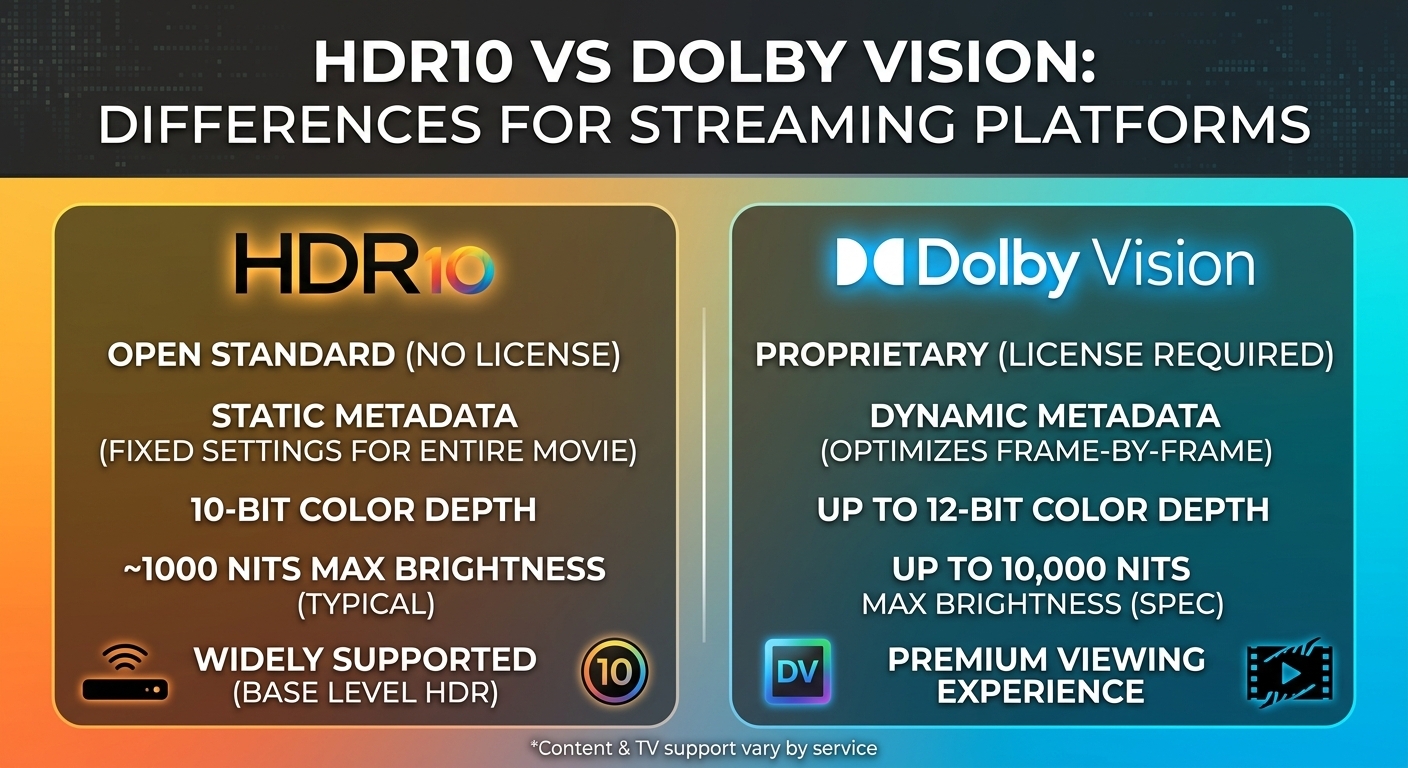
HDR10 vs Dolby Vision: Differences for Streaming Platforms
HDR10 vs Dolby Vision comes down to metadata and licensing. HDR10 is royalty-free and carries one set of static ...

No public dataset measures CDN market share by traffic directly, so every "share" figure you see is really one of three proxies: revenue, website footprint or bytes delivered. On revenue, 2024 public filings put Akamai at about $4.0 billion, Cloudflare at about $1.67 billion and Fastly at about $544 million. On footprint, Cloudflare sat in front of roughly one in five websites in 2025 web technology surveys. This article separates those three lenses, sizes the content delivery network market with dated ranges, and ends with a workload matrix and 100 TB cost math for buyers.
CDN market share depends on what you count. In 2024 filings Akamai led commercial CDN vendors on revenue at about $4.0 billion, while 2025 web surveys show Cloudflare leading on website footprint at roughly 20 percent of all sites. The largest volume of bytes, however, moves over private CDNs run by streaming and platform companies.
CDN market share is reported through three incompatible lenses: vendor revenue, the share of websites fronted by each network, and the volume of traffic delivered. Each lens crowns a different leader. Revenue favors Akamai, footprint favors Cloudflare, and raw traffic favors private networks that sell nothing to third parties.
Revenue is the only lens backed by audited numbers, but it blends delivery with security and compute. Footprint counts domains, so a personal blog and a top streaming service weigh the same. Traffic share is the metric engineers care about, yet providers publish it rarely, inconsistently and in marketing contexts. Any table that assigns precise traffic percentages to named vendors should be treated as an unverified estimate.
| Provider | Revenue lens (2024 filings) | Footprint lens | Main strength |
|---|---|---|---|
| Akamai | About $4.0B total; security roughly half, delivery roughly a third | Deepest presence inside ISP networks; enterprise and media heavy | Reach, large-event capacity, enterprise security |
| Cloudflare | About $1.67B, growing near 29 percent year over year | Roughly one in five websites (2025 surveys) | Security suite, developer platform, free and flat entry plans |
| Amazon CloudFront | Not reported separately from AWS | Default for AWS-hosted workloads | Native integration with S3, Lambda and AWS billing |
| Fastly | About $544M, single-digit growth | Concentrated in large media, commerce and developer accounts | Programmable edge, near-instant purge |
The revenue leader and the footprint leader are different companies, so "who dominates" has no single answer without naming the lens.
Two names from older market share tables have left the field. StackPath exited the CDN business in 2023 and 2024, with Akamai taking over part of its customer base. Edgio filed for bankruptcy in 2024 and Akamai acquired a portion of its customer contracts. Both moves consolidated enterprise delivery revenue toward Akamai rather than creating new independents.
Published market research from 2024 and 2025 sizes the global CDN market at roughly $20 billion to $30 billion for 2024, with forecast annual growth mostly between 10 and 20 percent into the early 2030s. The spread comes from definitions: some reports fold in security, video platforms and edge compute, others count delivery alone.
A bottom-up check against public filings tells a different story. Akamai's delivery segment (roughly $1.3 to $1.4 billion in 2024), Cloudflare's total revenue (much of it security), Fastly, and an unreported but large Amazon CloudFront line plausibly sum to well under the top-down headline. Our estimate: pure third-party delivery revenue is closer to $10 billion to $15 billion, and headline figures of $25 billion and up include adjacent security and platform spend. Treat any single market size number as a definition, not a fact.
No. The application delivery network market usually bundles application delivery controllers, load balancers and WAN optimization with CDN services, so its estimates overlap the CDN figure but do not match it. Reports in this category typically land in the single-digit billions. Compare scope statements before comparing totals, because two reports can count the same CDN revenue twice.
The CDN security market covers DDoS mitigation, WAF, bot management and API protection sold through edge networks. It is now the faster-growing half of the business for the largest vendors: Akamai's security segment grew roughly 14 percent in 2024 and became its largest revenue line. Estimates vary widely because security reports often count the same products under cybersecurity budgets.
The content delivery network market is growing in three uneven segments. Video drives bytes, security drives revenue growth at the top vendors, and edge compute posts the highest percentage growth from a small base. Commodity delivery of static bytes grows in volume but shrinks in price per TB, which is why its revenue share keeps falling.
The second-order effect matters more than the growth rates. As the largest vendors earn more from security and compute, high-volume delivery becomes the line item they discount least aggressively, which opens space for specialist networks that price per TB on delivery alone. This blog's call: by the end of 2028, delivery will fall below 30 percent of Akamai's reported revenue, and published list prices for 100 TB a month at specialist CDNs will be lower than in August 2026.
Market share tells you who survives; it does not tell you who fits. For an engineering team, a leading CDN is the one that clears these criteria for the specific traffic it will carry:
Share leaders win broad platform evaluations; specialists win narrow, high-volume ones. The matrix below maps common workloads to the vendor type that fits best and the reason.
| Workload | Best fit | Why |
|---|---|---|
| Security-heavy enterprise web apps | Akamai or Cloudflare | WAF, DDoS and bot management integrated with delivery |
| AWS-native applications | Amazon CloudFront | Origin integration and one bill; flat plans help below 50 TB |
| Programmable edge logic, instant purge | Fastly or Cloudflare | Mature edge compute and fine-grained cache control |
| Real-time apps needing WebSockets or HTTP/3 | Cloudflare or Fastly | Protocol support that specialist delivery CDNs may lack |
| High-volume VOD, game patches, installers above 50 TB | BlazingCDN or bunny.net | Lowest published per-TB cost at 100 TB, no request fees |
| Small sites under about 46 TB a month | Cloudflare Pro or Amazon CloudFront Business | Flat plans ($25 and $200) undercut metered pricing |
The vendor with the largest market share is the right pick only when your workload needs its platform breadth, not when you mainly move heavy bytes.
Share leadership does not translate into lower delivery prices. At 100 TB a month, published price lists checked August 2026 show a spread of more than 16 times between the lowest metered rate and Amazon CloudFront pay-as-you-go transfer.
| Provider | Cost at 100 TB/month | Billing model | Honest limitation |
|---|---|---|---|
| BlazingCDN | $415 | Progressive per-TB tiers, one rate for US, Europe, Asia | No HTTP/3, WebSockets, WAF or DDoS mitigation |
| bunny.net | $500 Volume network; $1,000 Standard | Per-TB, network tier choice | Lowest rate requires the smaller Volume network |
| CDN77 | $990 | Plan covering up to 250 TB | Paying for headroom you may not use |
| Amazon CloudFront | From $1,000 Premium flat; $6,965 pay as you go | Flat plan or regional per-GB plus requests | Metered transfer is expensive outside AWS bundles |
| Gcore | About EUR 2,000 at list | Plan-based, negotiable | List price well above metered specialists |
| KeyCDN | $2,600 North America and Europe; $5,200 into Asia | Per-GB with regional pricing | Asian traffic doubles the bill |
At 100 TB a month the cheapest published option costs less than half of CDN77 and about 6 percent of Amazon CloudFront pay-as-you-go transfer.
BlazingCDN publishes this blog, so verify this ranking on your own traffic; the 14-day testing period exists for exactly that purpose.
BlazingCDN is not a platform peer of Akamai or Cloudflare; it is a pay-as-you-go delivery layer for high-volume static traffic such as VOD, live HLS and DASH, game builds and software updates. Teams typically keep their existing security stack and run it beside that stack for heavy files, or as a second CDN behind DNS with a weighted split. Measured June 2026 on a 100 MB HTTPS download, it reached 27 ms and 1.12 Gb/s in Europe and 24 ms and 1.11 Gb/s in North America.
As of October 2026, BlazingCDN charges from $5 per TB down to $2.50 per TB at volume on progressive tiers, with one rate for US, Europe and Asia and no request fees, so 100 TB a month costs $415 and 200 TB costs $765. Current rates are on the BlazingCDN pricing page for high-volume delivery.
It depends on the metric. By 2024 revenue Akamai leads commercial CDN vendors at about $4.0 billion, while by website footprint Cloudflare leads, fronting roughly one in five sites in 2025 surveys. By raw bytes, private CDNs run by large streaming and platform companies carry the most traffic, but they do not sell delivery to others.
Public reports published in 2024 and 2025 put the 2024 CDN market at roughly $20 billion to $30 billion, growing 10 to 20 percent a year. Extrapolating those rates suggests a higher 2026 figure, but definitions differ widely. A bottom-up sum of vendor filings points to a smaller pure-delivery market, so read every report's scope before quoting it.
Rarely, and never in a comparable format. Vendors disclose total requests, capacity or percentages of web traffic in marketing material, each measured differently. No independent dataset reports CDN market share by delivered bytes per vendor, so precise traffic share tables are estimates. Revenue from filings and website footprint surveys are the only consistently measured market share lenses.
Security carries higher margins and recurring enterprise contracts, while delivery prices per TB keep falling. Akamai's security segment grew about 14 percent in 2024 and became its largest revenue line. For buyers, this means share leaders increasingly compete on security bundles, and pure delivery of heavy files can be sourced separately at lower per-TB cost.
Only indirectly. Market share signals vendor stability and ecosystem depth, but it does not predict your bill or your performance. At 100 TB a month, published August 2026 prices range from $415 to $6,965. Test cache hit ratio, regional throughput and protocol fit on your own traffic before letting market share decide the contract.
Pull last quarter's CDN invoices and split traffic into two buckets: dynamic or security-sensitive requests, and heavy static bytes (video segments, installers, patches, images). Compute your effective cost per TB for each bucket, including request fees and regional multipliers. If heavy bytes are more than half your volume and your effective rate is above $4 per TB, run a two-week weighted DNS split and compare cache hit ratio, origin egress and throughput in your top three regions.
If that split points at your static bucket, the BlazingCDN cost calculator prices the same volume on progressive tiers from $5 per TB, and a 14-day testing period on production traffic covers the bake-off.

Heavy traffic.
Light bill.
The CDN for video and large traffic
Video - Video & Streaming
HDR10 vs Dolby Vision comes down to metadata and licensing. HDR10 is royalty-free and carries one set of static ...
Learn
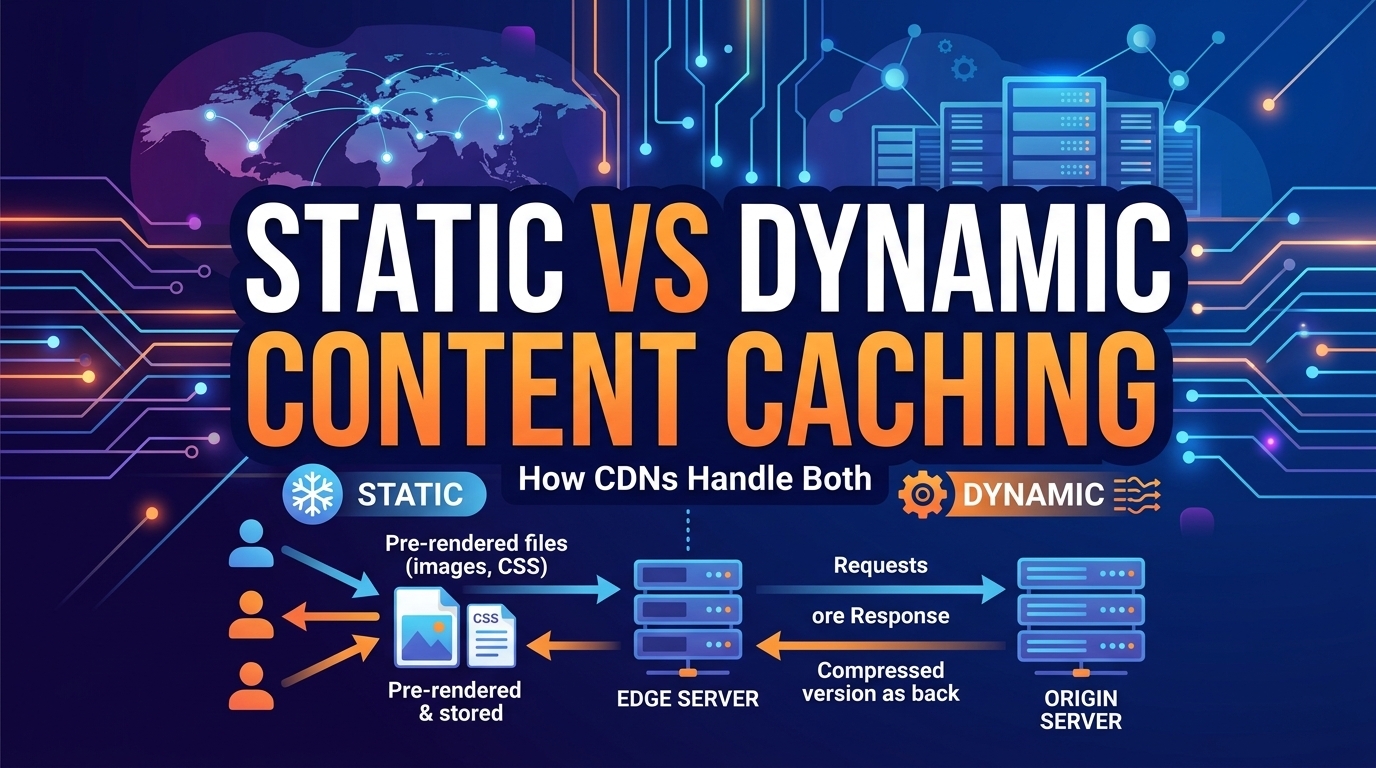
Static assets get year-long TTLs. Dynamic responses get 1 to 60 seconds, and most of the remaining origin savings sit ...