
Learn
What Is TTFB? Time to First Byte Explained and How to Cut It
Time to first byte (TTFB) is the time from the moment a client starts a request until the first byte of the response ...
A 1 Gbps link can never deliver more than 125 megabytes per second, and once Ethernet framing and TCP/IP headers are paid for, a single download tops out near 118 MB/s. That ceiling is the short answer to what is bandwidth: a capacity limit, not a promise of delivered speed. This explainer covers what bandwidth measures, a side-by-side table against throughput and latency, the Mbps vs MB/s conversion that trips up dashboards, worked math for streaming and large downloads, and a failure-mode matrix for confirming which constraint is actually slowing you down.
Bandwidth is the maximum rate a network path can carry data, measured in bits per second (Mbps, Gbps). As of 2026, a 1 Gbps Ethernet link caps TCP payload at roughly 949 Mbps (about 118.6 MB/s) on a standard 1,500-byte MTU, and the throughput a single application sees is usually lower, set by latency, packet loss and TCP window size.
In networking, bandwidth means the maximum data transfer rate a communication path can sustain, expressed in bits per second. It describes capacity: how much the pipe can carry. It says nothing about how much a given application actually receives, how long each packet takes to arrive, or how many bytes moved over a billing period.
The word gets attached to very different things, and the measurement point changes the number. A switch port reports its line rate. An ISP circuit may have a committed rate plus a burst allowance. A radio channel's bandwidth depends on modulation and signal quality, so it moves minute to minute. A traffic policer or shaper can impose a lower ceiling on a fast physical link. When two teams argue about "the bandwidth", they are often quoting different layers of the same path.
The effective bandwidth of an end-to-end path is the minimum across every hop: NIC, host queue, access link, transit, peering, and the far-end server. Upgrading one segment does nothing if another is narrower.
| Metric | What it measures | Unit | Example on a 1 Gbps, 80 ms path |
|---|---|---|---|
| Bandwidth | Maximum possible rate of the path | bps, Mbps, Gbps | 1 Gbps |
| Throughput | Rate actually achieved by a flow or workload | bps, Mbps | 400 Mbps for one flow with a 4 MB window |
| Goodput | Useful payload after headers and retransmissions | bps, MB/s | About 380 Mbps of file bytes |
| Latency | Time for data to cross the path (often as round-trip time) | ms | 80 ms RTT |
| Transfer volume | Total bytes moved over a period | GB, TB per month | Up to 324 TB if saturated for 30 days |
On high-latency paths, a single flow's throughput is often limited by the TCP window rather than by the link's bandwidth.
Bandwidth is the maximum rate a path supports; throughput is the rate a real transfer achieves. Throughput is always equal to or lower than bandwidth, and the gap comes from latency, packet loss, congestion control, receive windows, CPU and disk limits on either host, and competing flows sharing the same queue.
The window math explains most of the gap. One TCP flow can move at most one window of data per round trip. A 4 MB window over an 80 ms RTT gives 32 megabits per 0.08 seconds, or 400 Mbps, no matter whether the link is 1 Gbps or 100 Gbps. To fill a path you need a window equal to the bandwidth-delay product: 1 Gbps multiplied by 80 ms is 80 megabits, or 10 MB. A host without window scaling, stuck at 64 KB, gets about 6.5 Mbps on the same path.
Loss compounds it. The classic Reno-style model puts single-flow throughput near 1.22 times MSS divided by RTT times the square root of the loss rate. With a 1,460-byte MSS, 100 ms RTT and 0.01% loss, that is about 14 Mbps. CUBIC and BBR behave better than this model, but the direction holds: past a certain point, more bandwidth stops helping and lower loss or RTT starts helping.
Latency is delay, bandwidth is capacity, and adding one does not reduce the other. A 10 Gbps transatlantic circuit still has roughly 70 to 80 ms of round-trip time from propagation alone. What latency does change is how much bandwidth a single connection can use, which is why moving content closer to users raises per-flow throughput without touching link speed.
Bandwidth is a rate; volume is a total. A link sustained at 1 Gbps for a 30-day month moves 125 MB/s multiplied by 2,592,000 seconds, about 324 TB. Providers bill on either axis: committed rate or 95th percentile for ports and transit, per-TB volume for most CDN and cloud egress. Mixing the two in a capacity plan produces wrong budgets.
Bandwidth is measured in bits per second: bps, Kbps, Mbps, Gbps and Tbps, using decimal prefixes (1 Mbps is 1,000,000 bits per second). File sizes and download speeds are usually shown in bytes, so divide the bit rate by 8. A 100 Mbps connection delivers at most 12.5 MB/s before protocol overhead.
Three conversions cover most confusion:
Operationally, rates come from interface counters: octets, packets, drops, errors, discards and queue depth, sampled through SNMP, streaming telemetry, sFlow, NetFlow or IPFIX. The rate is the change in octets multiplied by 8, divided by the interval. Use the 64-bit counters (ifHCInOctets and ifHCOutOctets): a 32-bit octet counter wraps after about 4.29 GB, which on a busy 10 Gbps port is roughly every 3.4 seconds.
The sampling interval matters as much as the counter. A five-minute average of 40% utilization can hide bursts at 100% lasting a few milliseconds. As an illustration, a 10 Gbps port with a 12 MB buffer can absorb only about 9.6 ms of line-rate overflow before it drops, so microbursts cause loss that a five-minute graph never shows.
When offered load exceeds bandwidth at any hop, the device buffers, delays, marks or drops packets. Buffers add latency first (bufferbloat), then overflow into drops. Active queue management and ECN marking signal congestion earlier, and policers drop anything above the contracted rate without queuing at all.
TCP responds through congestion control, shrinking its window when it sees loss or ECN marks and reducing throughput for every flow sharing the queue. UDP has no built-in response, so real-time media, QUIC stacks and game traffic must adapt at the application layer: lower bitrate, fewer packets, or forward error correction.
Size bandwidth for peak and p99 demand, not averages. Multiply concurrent sessions by per-session bitrate, then add headroom for failover and bursts. For downloads, divide file size in bits by the target completion time. Model edge egress, origin traffic, cache fill, revalidation and ingest as separate paths, because each has its own bottleneck.
Worked examples, all arithmetic with stated assumptions:
The same capacity question applies at every layer: access links, cloud egress, transit ports, VPN tunnels, peering, load balancers and CDN paths. A CDN absorbs most edge capacity planning, but origin bandwidth, cacheability and cache-fill behavior during content churn still decide whether the origin holds up.
Most "we need more bandwidth" tickets are throughput problems with a different root cause. The matrix below maps the symptom to the constraint and the measurement that confirms it.
| Symptom | Likely constraint | How to confirm |
|---|---|---|
| One flow slow, parallel flows fill the link | TCP window below bandwidth-delay product | Compare a single-stream and an 8-stream iperf3 run; check socket buffer limits |
| Graphs show 40% utilization, users report stalls | Microbursts and buffer overflow | One-second or sub-second telemetry; output discards rising during bursts |
| Throughput flat at an exact round number | Policer or shaper | Policer exceed counters; drops without queue growth |
| Latency climbs with load, few drops | Bufferbloat | RTT under load vs idle; queue depth |
| Fast in one region, slow in another | RTT and loss on long paths, or congested peering | TCP retransmission rate and RTT per region |
| Link idle, transfer still slow | Host limit: CPU, TLS, disk or application | Per-core CPU, disk read rate, application timing |
Only one of these six rows is fixed by buying more bandwidth, so confirm the constraint before you upgrade the circuit.
Pull one-second telemetry for the busiest path and line it up against drops, queue depth, discards, ECN marks, policer statistics and TCP retransmissions. If utilization shows spare capacity while users see slow transfers, you are monitoring the wrong segment, or measuring bandwidth when the real limit is throughput.
On Linux hosts, the common single-flow fix is socket buffer sizing: set net.core.rmem_max and net.core.wmem_max, plus the maximum (third) value of net.ipv4.tcp_rmem and net.ipv4.tcp_wmem, to at least the path's bandwidth-delay product. For 1 Gbps at 100 ms that is 12.5 MB, so 16777216 bytes (16 MB) leaves headroom. The trade-off is memory: large buffers on thousands of idle connections waste RAM, which is why autotuning only grows them under demand. Related terms such as latency and throughput get their own entries in the CDN and networking glossary.
Bandwidth is the maximum rate a network path can carry, while throughput is the rate a real transfer actually achieves. Throughput is always lower or equal, limited by round-trip time, packet loss, TCP window size, congestion and host resources. A single flow with a 4 MB window over an 80 ms path tops out at 400 Mbps even on a 10 Gbps link.
No, 100 Mbps bandwidth equals 12.5 MB/s, because network bandwidth is measured in bits and file transfers in bytes, with 8 bits per byte. After TCP/IP and Ethernet overhead, expect about 11.8 MB/s of file data. Some operating systems display binary megabytes, which shows the same speed as roughly 11.3 "MB/s".
A single 4K video stream typically needs about 15 to 25 Mbps of sustained bandwidth in 2026, depending on codec and the top rung of the bitrate ladder. For a delivery platform, multiply peak concurrent viewers by average delivered bitrate: 10,000 viewers at 20 Mbps need 200 Gbps of edge capacity, plus failover headroom and origin cache-fill capacity.
More bandwidth does not reduce propagation latency, which is set by distance and the speed of light in fiber. It can reduce queuing latency when a link is congested, because packets wait less in buffers. For per-flow speed on long paths, lowering round-trip time or packet loss usually helps more than adding link capacity.
A download runs slower than available bandwidth when something other than link capacity limits throughput: a TCP window smaller than the bandwidth-delay product, packet loss, a policer, server CPU or disk limits, or congestion at a peering point. Test with one flow and with several parallel flows; if parallel flows fill the link, the window or loss is the constraint.
Pick your heaviest delivery path and collect one-second interface counters alongside per-region TCP retransmission rate and RTT for seven days. Run a single-stream and an 8-stream iperf3 test across the same path, then compute the bandwidth-delay product for your p95 RTT and compare it with your hosts' socket buffer limits. If parallel streams win by more than 2x, tune windows before you buy capacity. For a public reference point, BlazingCDN publishes its 100 MB HTTPS download results, measured June 2026 (Europe 27 ms and 1.12 Gb/s, North America 24 ms and 1.11 Gb/s, Asia 47 ms and 761 Mb/s), with a test file on its CDN performance metrics page, so you can compare delivered throughput from your own clients.

Heavy traffic.
Light bill.
The CDN for video and large traffic
Learn
Time to first byte (TTFB) is the time from the moment a client starts a request until the first byte of the response ...
Video - Video & Streaming
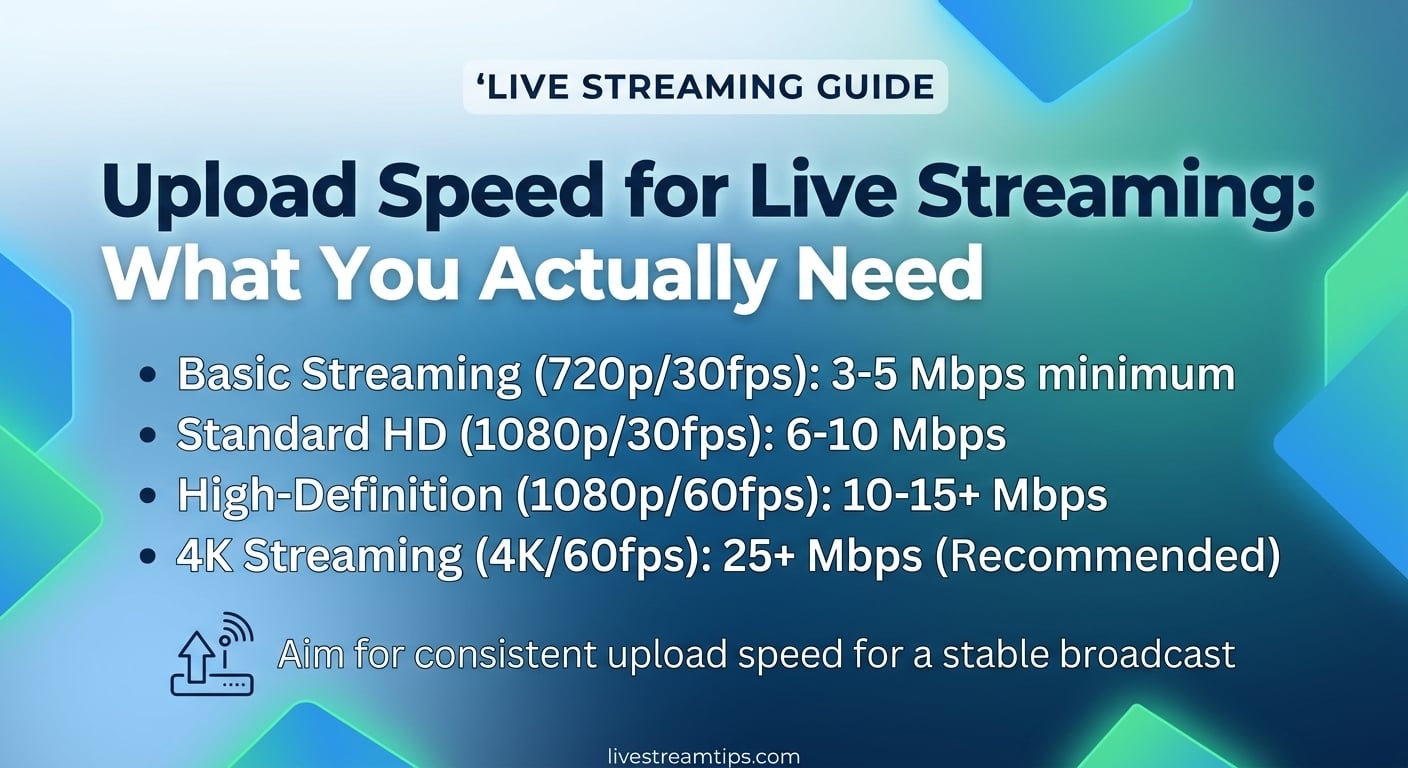
Plan your upload speed for streaming at about 1.6 times the total bitrate you push, measured as sustained ...