

Learn
cdnjs Explained: How the Public JavaScript CDN Works
cdnjs is an open-source public JavaScript CDN that serves more than 4,000 libraries (2025 index size) from Cloudflare's ...
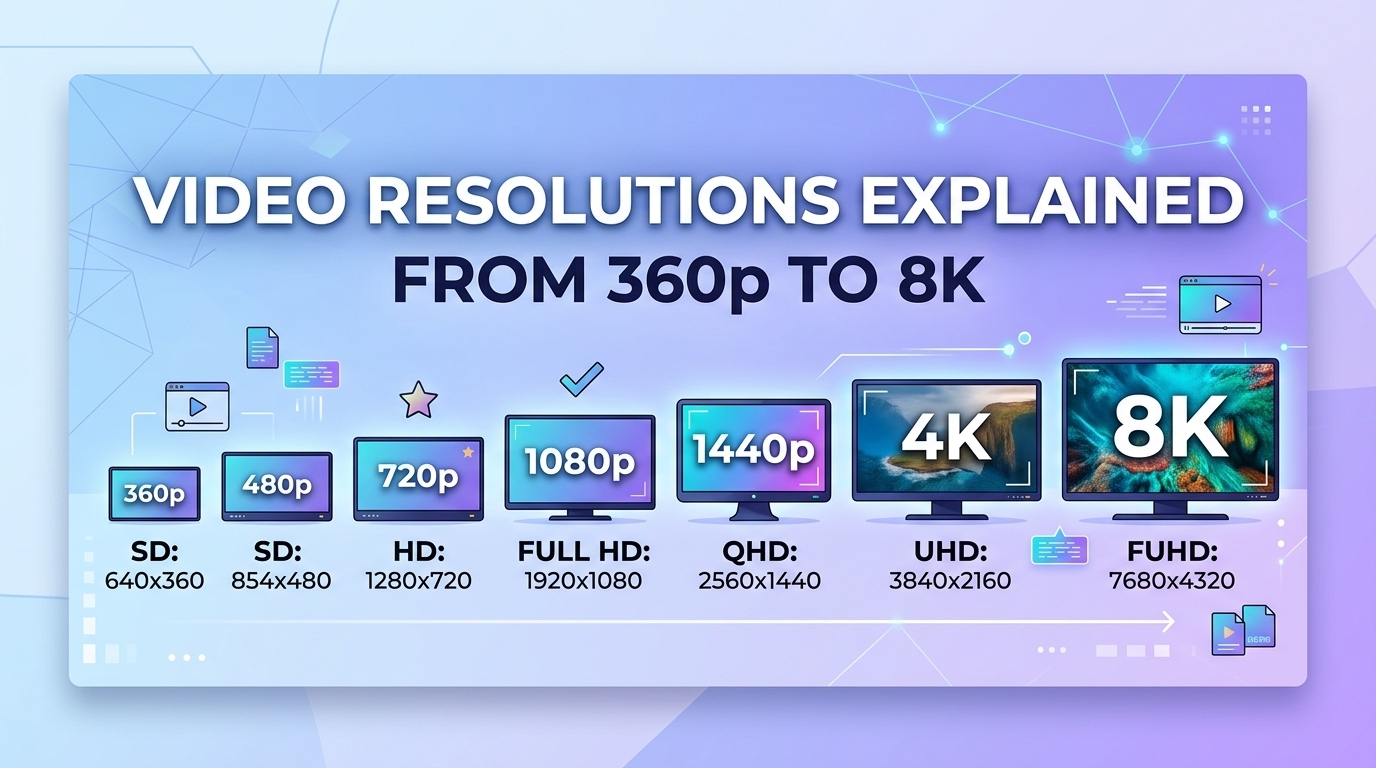
Video resolutions run from 360p (640 x 360, about 230,000 pixels) to 8K (7680 x 4320, about 33.2 million pixels), a 144x spread in pixel count. Bitrate grows much more slowly than pixel count. As of 2026, typical streaming encodes put 360p at 0.4 to 1 Mbps and 1080p at 4.5 to 8 Mbps in H.264, 4K at 12 to 20 Mbps in HEVC or AV1, and 8K at 40 to 80 Mbps.
For delivery engineers the useful conversion is simpler than any resolution chart. One hour of video costs 0.45 GB of egress per Mbps of bitrate, so a 6 Mbps 1080p stream moves 2.7 GB per viewing hour and a 16 Mbps 4K stream moves 7.2 GB. The rest of this article turns that rule into ladder design decisions, with the egress math to defend them.
The table below lists the standard 16:9 resolutions used in HTTP Live Streaming (HLS) and MPEG-DASH ladders, their pixel counts relative to 1080p, and typical bitrate ranges for on-demand content at good perceptual quality. Ranges are typical 2026 encoding targets, not hard rules: per-title encoding can move any row by 30 to 50 percent depending on content complexity.
| Resolution | Dimensions | Pixels | vs 1080p | Typical H.264 | Typical HEVC or AV1 | GB per viewing hour (example rate) |
|---|---|---|---|---|---|---|
| 360p | 640 x 360 | 230,400 | 0.11x | 0.4 to 1.0 Mbps | 0.25 to 0.6 Mbps | 0.32 GB (0.7 Mbps) |
| 480p | 854 x 480 | 409,920 | 0.20x | 1.0 to 2.0 Mbps | 0.6 to 1.2 Mbps | 0.68 GB (1.5 Mbps) |
| 720p | 1280 x 720 | 921,600 | 0.44x | 2.5 to 4.5 Mbps | 1.5 to 3.0 Mbps | 1.58 GB (3.5 Mbps) |
| 1080p | 1920 x 1080 | 2,073,600 | 1x | 4.5 to 8 Mbps | 3 to 5 Mbps | 2.7 GB (6 Mbps) |
| 1440p | 2560 x 1440 | 3,686,400 | 1.78x | 9 to 14 Mbps | 6 to 9 Mbps | 4.5 GB (10 Mbps) |
| 4K UHD | 3840 x 2160 | 8,294,400 | 4x | 25 to 40 Mbps (rarely used) | 12 to 20 Mbps | 7.2 GB (16 Mbps) |
| 8K | 7680 x 4320 | 33,177,600 | 16x | not practical | 40 to 80 Mbps | 22.5 GB (50 Mbps) |
Every step up the chart multiplies pixels faster than bytes, but the top two rows still cost 3 to 8 times the egress of 1080p per viewing hour.
A viewer needs sustained throughput of roughly 1.3 to 1.5 times a rendition's average bitrate to hold it without rebuffering. That puts practical floors at about 1 to 1.5 Mbps for 360p, 8 to 10 Mbps for 1080p in H.264, 20 to 25 Mbps for 4K in HEVC, and 60 Mbps or more for 8K.
The headroom exists for two reasons. Variable bitrate (VBR) encodes spike well above their average on high-motion scenes, and a capped VBR encode with a peak of 1.5x average and a buffer of 2x average is a common configuration. Second, most adaptive bitrate (ABR) players only commit to a rung when measured throughput exceeds it by a safety margin of 20 to 30 percent, because throughput estimates on cellular and congested Wi-Fi swing by that much between segments.
Resolution is therefore a delivery parameter, not just an encoding one. The rung a viewer actually lands on is decided by last-mile throughput, segment download time from the edge, and the player's estimator. If time to first byte on segments is high, the estimator reads low throughput and the player drops a rung even on a fast connection. Edge latency shows up on screen as resolution.
The 360p rung exists for startup and survival, not for quality. Players often begin on a low rung to minimize time to first frame, and a 0.5 to 1 Mbps rendition keeps playback alive on congested cellular links where the next rung up would stall. Removing it trades a small storage saving for higher rebuffer and abandonment rates.
Its share of bytes is tiny. In the worked example below, 360p carries 5 percent of viewing hours but under 1 percent of egress. Some ladders go further and add a 234p or 270p rung at 145 to 300 kbps for markets with weak mobile coverage. Whether that pays off depends entirely on your audience's network mix, which is an analytics question, not an encoding one.
4K pays for itself only when viewers watch on large screens at close range and the content has fine detail. On a phone or a laptop at normal distance, 1080p is perceptually close to 4K while using 2.5 to 3 times less bandwidth. On a 65-inch television from about 2 metres, the difference is visible and subscribers notice it.
The bitrate gap is smaller than the 4x pixel gap because modern codecs exploit spatial redundancy better at higher resolutions, and because 4K is almost always shipped in HEVC or AV1 rather than H.264. A typical pairing in 2026 is 1080p H.264 at 6 Mbps against 4K HEVC at 16 Mbps. That is 2.7x the egress per viewing hour, which is the number your finance team cares about.
8K is a different conversation. Panel share among streaming viewers remains very small, content captured natively in 8K is scarce, and the 16x pixel count lands at 40 to 80 Mbps even with AV1. For most services in 2026, an 8K rung is a marketing feature with a large storage line and almost no measurable quality-of-experience benefit.
Consider a VOD service delivering 100,000 viewing hours a month. Using the example rates from the chart (0.32, 0.68, 1.58 and 2.7 GB per hour for 360p through 1080p), here is how the rendition mix drives monthly transfer. Decimal units throughout: 1 TB equals 1,000 GB.
The pattern generalizes: egress tracks the rendition mix of the top rungs, and the top rung's share of hours is the single number to model before adding it. On BlazingCDN's published progressive tiers as of October 2026, Ladder A's 210 TB costs $800 a month ($415 for the first 100 TB plus 110 TB at $3.50) and Ladder B's 277 TB costs $1,034.50, with current rates on the BlazingCDN CDN pricing page. Run the same three mixes against your own contract rate before committing to a 4K rung.
The steps below describe a practical ladder for mixed-device VOD in words rather than as a pasted command. They translate directly into flags for ffmpeg or any commercial encoder.
Every rung multiplies storage and splits cache. Storage per content hour equals the sum of all rung bitrates times 0.45 GB. Ladder A totals 11.7 Mbps, or 5.3 GB per content hour. Adding 4K at 16 Mbps lifts that to 12.5 GB, and adding 8K at 50 Mbps lifts it to 35 GB, a 6.6x increase for renditions few viewers ever request. Shipping parallel H.264 and AV1 ladders roughly doubles it again.
Cache fragmentation is the quieter cost. A long-tail title with eight renditions spreads its requests across eight sets of segments, so each object sees fewer hits and is more likely to be evicted. Top rungs on catalog titles are the usual cache misses, and those misses hit origin at the highest bitrate. Origin shielding and pre-warming popular top rungs mitigate this; pruning unused rungs fixes it.
Common failure modes worth instrumenting:
Group a month of CDN access logs by rendition path and sum bytes per rung; compare the mix to the worked example. From player telemetry, chart the chosen bitrate against measured throughput, plus rebuffer ratio and time to first frame per rung. Check segment Content-Length per rendition against your target bitrates to catch encoder drift, and check cache status per rung to find top-rung misses.
This approach fits VOD and OTT services with mixed device audiences, education platforms where most viewing is on laptops, and any team paying metered egress that needs to justify each rung with numbers. It fits less well for low-latency live, where segment duration and encoder density are dominated by latency targets, and for premium film catalogs where 4K HDR is a contractual requirement regardless of byte cost.
4K streaming typically needs a sustained connection of 20 to 25 Mbps when encoded in HEVC or AV1 at 12 to 20 Mbps average. The extra headroom covers bitrate peaks in capped VBR encodes and the safety margin adaptive bitrate players apply before switching up. Delivering 4K in H.264 would push the requirement toward 40 Mbps, which is why services rarely do it.
A 1080p stream uses about 2 to 3.6 GB per hour, depending on bitrate. The conversion is 0.45 GB per hour for each Mbps, so a 6 Mbps H.264 encode moves 2.7 GB per viewing hour. HEVC or AV1 at 3 to 5 Mbps brings 1080p down to roughly 1.4 to 2.3 GB per hour at similar perceived quality.
Yes, a 360p rung remains worth including in most streaming ladders because it protects startup time and keeps playback alive on congested mobile networks. At 0.4 to 1 Mbps it costs very little storage and usually carries under 1 percent of total egress, while removing it tends to increase rebuffering for viewers on weak connections.
For most streaming services, an 8K rendition is not worth adding in 2026. It needs 40 to 80 Mbps even with AV1, multiplies ladder storage several times over, and very few viewers own 8K panels at viewing distances where the extra detail is visible. Native 8K content is also scarce, so most 8K streams are upscaled sources.
This week, export one month of CDN logs, sum bytes per rendition, and divide by viewing hours to get your real GB per hour. Then rerun the worked example with your own mix: move the share of large-screen hours to a 4K rung and see how much transfer the change adds. If the top rung carries less than 10 percent of hours, test capping it to large-screen devices only and compare rebuffer ratio and egress over two weeks.
If your catalog is VOD at that scale, the BlazingCDN Video CDN for on-demand libraries replicates the library inside the CDN so origin stays out of the delivery path, and its 14-day testing period runs on real production traffic.

Heavy traffic.
Light bill.
The CDN for video and large traffic
Learn
cdnjs is an open-source public JavaScript CDN that serves more than 4,000 libraries (2025 index size) from Cloudflare's ...
Learn
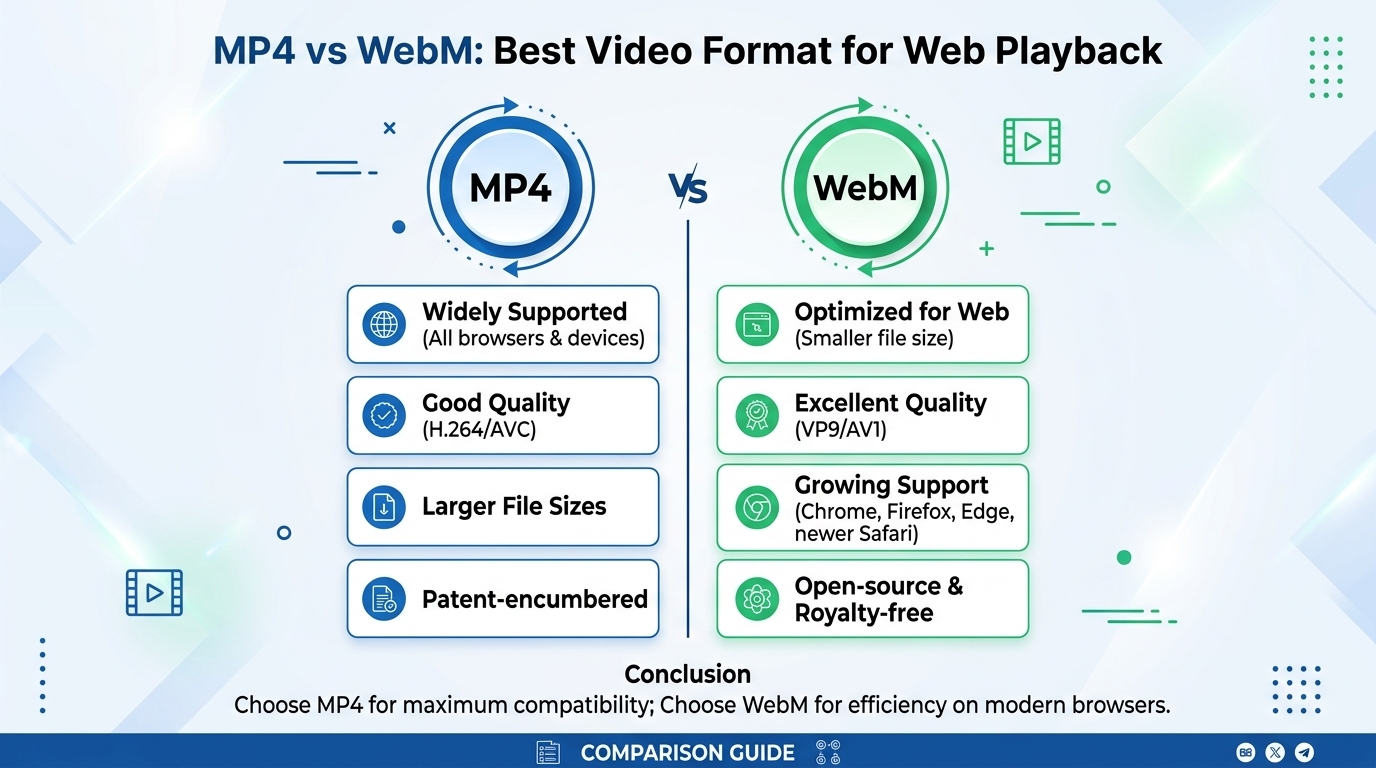
For web playback in 2026, ship MP4 (H.264 video, AAC audio) as the universal baseline and add WebM (VP9 or AV1) as a ...