
Learn
Lossy vs Lossless Compression: Images, Video and Audio
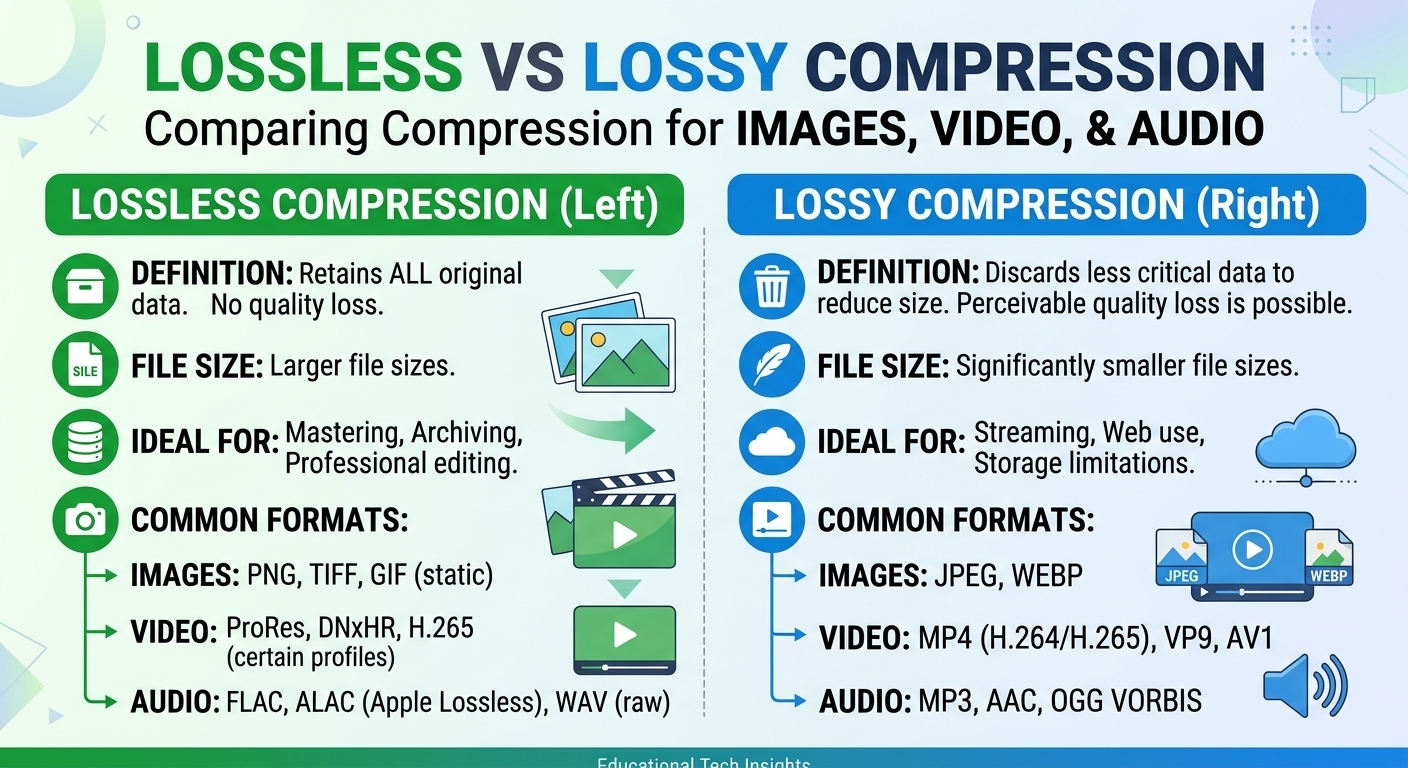
Lossy vs lossless compression comes down to one trade: lossless compression rebuilds every original bit and typically ...
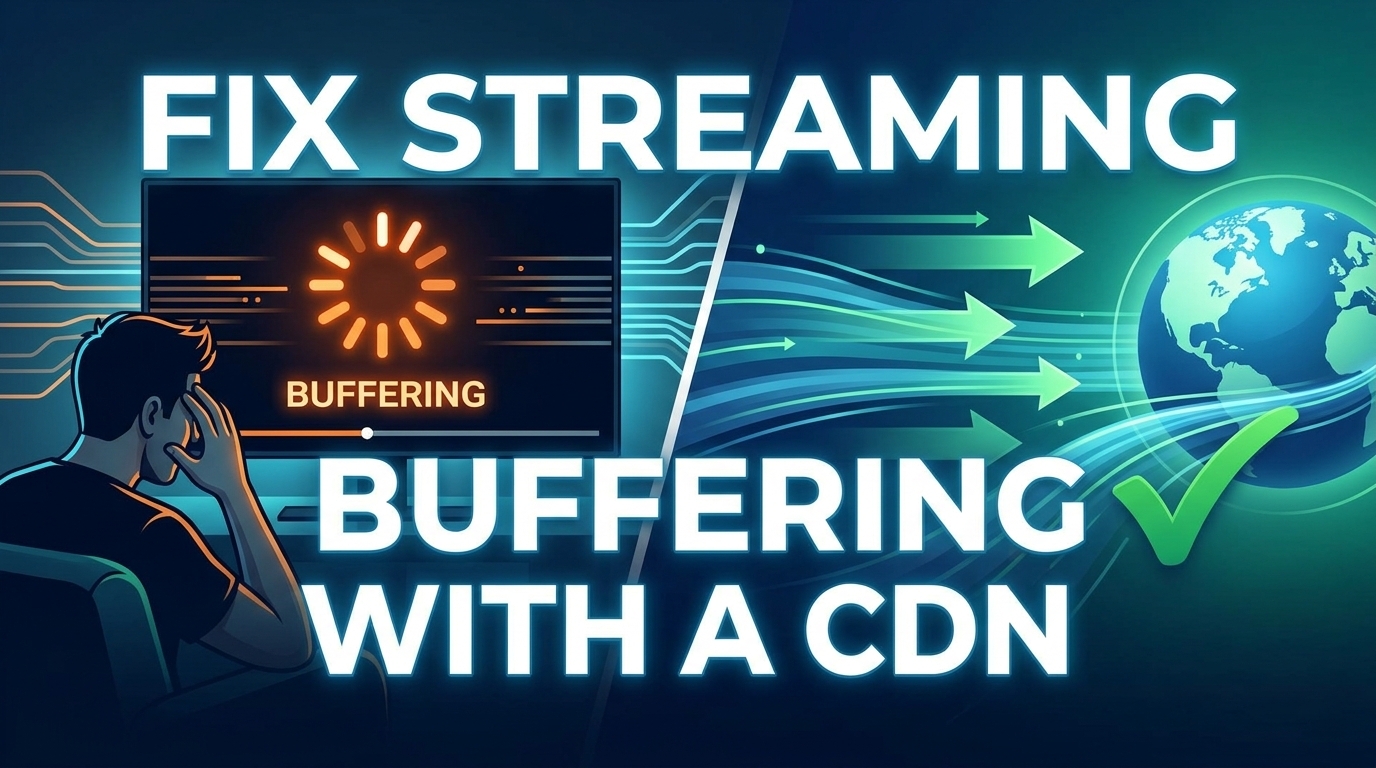
Most teams debugging buffering videos start with the wrong hypothesis: bandwidth. In practice, the majority of rebuffer events on well-provisioned networks trace back to three delivery-side faults — a bitrate ladder whose bottom rung is too high, segment requests that miss cache and traverse the full path to origin, and player buffer targets tuned for a network that no longer exists. This article gives you the diagnostic order of operations, the threshold values that separate healthy from broken, the cache-warming pattern that eliminates the launch-day miss storm, and a cost model for what fixing it actually costs per terabyte in 2026.
Rebuffering is a queueing problem, not a capacity problem. The player drains its buffer at exactly one second of media per second of wall clock. It refills at whatever throughput the current segment fetch achieves. Buffering videos happen when the fetch rate for a segment falls below its playback duration for long enough to exhaust the buffer — which on a 4-second segment ladder means a single 6-second stall on one request is enough, even if the pipe measures 200 Mbps on a speed test.
The distinction matters because it changes what you fix. Throughput averages hide the tail. A connection that sustains 50 Mbps median and dips to 800 Kbps for four seconds during a Wi-Fi channel scan will rebuffer, while a flat 8 Mbps link will not. This is why 2026 rebuffer postmortems increasingly focus on p95 and p99 segment download time rather than mean bandwidth.
You cannot tune what you do not instrument. The single most useful metric is rebuffer ratio: total rebuffering time divided by total watch time, excluding startup. Report it as a percentage, segmented by CDN edge region, ASN, device class, and content type. An aggregate number is close to useless because a healthy 0.4% global figure routinely conceals a 4% figure on one mobile carrier.
Alongside it, instrument these four. They are what actually drive the diagnosis.
| Metric | Healthy (2026 VOD target) | Investigate above | What it implicates |
|---|---|---|---|
| Rebuffer ratio | Under 0.5% | 1.0% | Everything; start here, then segment |
| Video start time (p75) | Under 1.5 s | 2.5 s | Manifest latency, DNS, TLS, cold cache |
| Segment TTFB (p95) | Under 120 ms | 300 ms | Cache miss, origin distance, shield gap |
| Cache hit ratio (segments) | Above 96% | Below 90% | Cardinality, query strings, short TTL |
One caveat on measurement itself: player-side beacons batched on a 30-second interval lose the tail of every session that ends in abandonment — exactly the sessions with the worst rebuffering. Use a shorter beacon cadence or an unload flush, or your dashboard will systematically under-report the problem you are trying to solve.
Ladders inherited from 2019 templates are a common cause of buffering videos in 2026. Two specific faults dominate.
The bottom rung is too high. If your lowest rendition is 800 Kbps at 480p, every viewer whose sustained throughput falls under roughly 1.1 Mbps has no rung to fall back to. They rebuffer instead of degrading. Add a genuine floor — around 300 to 400 Kbps at 360p — and accept that it looks poor. A poor picture retains a session; a spinner does not.
The rungs are too far apart. Gaps larger than roughly 1.5× between adjacent rungs force the ABR algorithm into large, slow switches. Keep the ratio between 1.4× and 1.6× across the working range, which for most catalogues means six to eight renditions rather than four.
Per-title encoding remains the highest-leverage change available. Animation and static talking-head content converge at far lower bitrates than sports, and a fixed ladder wastes bits on the former while starving the latter. If you have not moved off a fixed ladder, this is a bigger win than any codec migration.
On codecs, as of 2026 AV1 hardware decode is broadly present on recent mobile silicon and smart TVs but not universal, so it belongs in an additive ladder alongside H.264, not as a replacement. HEVC remains the pragmatic middle rung for TV apps. Shorter segments help too: moving from 10-second to 4-second segments cuts the worst-case stall window substantially, at the cost of more requests and slightly worse compression efficiency. Under 2 seconds, request overhead and per-object cache pressure start working against you unless you are running low-latency CMAF with chunked transfer.
The classic pattern: a title drops at 09:00, tens of thousands of players request the same first segments within a two-minute window, and every edge that has never seen those objects goes to origin simultaneously. Origin CPU spikes, TTFB climbs past a second, and rebuffer ratio triples for the first ten minutes before the cache fills and everything looks fine again. Postmortems often blame the origin. The real fault is the absence of a warming step.
Three mitigations, in order of effort:
Set segment TTLs long — media segments are immutable, so days rather than minutes — and keep manifest TTLs short. Strip cache-irrelevant query parameters from the cache key. Session tokens and analytics parameters in the key are a frequent, quietly catastrophic source of a 40% hit ratio.
This is the section most buffering articles omit. Below are failure modes seen repeatedly in live and VOD delivery, with the signature that identifies each.
Signature: high switch frequency, moderate rebuffer ratio, viewer complaints about "flickering" quality. Cause is usually an aggressive throughput estimator combined with wide rung gaps. Fix by smoothing the estimator window and tightening the ladder rather than by adding bandwidth.
Signature: periodic TTFB spikes synchronised to the segment duration. Every player refreshes the manifest at the same instant. Stagger refresh with jitter and serve manifests with a TTL just under segment duration so the edge absorbs the burst.
Signature: global rebuffer ratio flat, one ASN at 5%. Almost always a peering or transit issue between that carrier and the serving edge. Nothing in your encoding stack will fix it; you need routing change or a second delivery path.
Signature: hit ratio drops a few points, TTFB p99 goes to seconds, error rate stays near zero. Origin storage is rate-limiting fetches rather than failing them. Check origin-side request concurrency limits before touching the CDN.
Every delivery change — ladder, TTL, segment duration, cache key — should ship behind a percentage rollout with rebuffer ratio as the gating metric, evaluated over at least one full daily traffic cycle. Ladder changes in particular look fine at 5% on desktop and fall apart at scale on constrained mobile. Keep the previous ladder packaged and addressable so rollback is a manifest swap, not a re-encode.
Cutting rebuffering usually increases egress, because viewers who stop abandoning watch more, and higher rungs get served more often. Model that before you commit. A platform moving 500 TB per month that improves completion rate by 12% should plan for roughly 560 to 600 TB.
Pricing across the high-volume delivery tier in 2026 clusters tightly. Bunny.net and KeyCDN remain strong on simplicity and low entry cost for smaller catalogues. CDN77 and Gcore compete well on European and Asian streaming footprints, and Fastly is the right answer when you need programmable edge logic in the request path. Choose on the axis that matters for your workload rather than on headline rate alone.
For teams optimising cost per terabyte at sustained volume, BlazingCDN's media delivery platform is worth a benchmark slot. It runs NVMe SSD edge storage with Anycast routing and built-in failover. Pricing is pay-as-you-go: starting at $5 per TB, down to $2.50 per TB at volume (as of October 2026), for example $415 for 100 TB and $1,815 for 500 TB, with a $25 monthly minimum. Configuration is flexible enough to set per-path TTLs and cache keys without a support ticket, and onboarding typically runs about an hour.
Because playback depends on sustained throughput during each segment fetch, not on peak bandwidth. A four-second collapse in throughput from Wi-Fi contention or cellular handover can empty the player buffer even on a 200 Mbps link. Look at p95 segment download time, not average bandwidth.
Under 0.5% for VOD and under 1% for live is a reasonable 2026 target for a well-tuned delivery path. More important than the aggregate is the distribution: segment by ASN, region, and device class, because a healthy global average routinely hides a badly degraded carrier or device family.
It removes the origin-distance and cache-miss classes of buffering, which are often the largest single contributor. It does nothing for last-mile variance or a ladder with no low rung. Pair edge delivery with a floor rendition around 300 to 400 Kbps and rung spacing near 1.5×.
Yes, up to a point. Moving from 10-second to 4-second segments shortens the worst-case stall and lets ABR react faster. Below roughly 2 seconds, per-request overhead and cache object count begin to outweigh the benefit unless you are running low-latency CMAF with chunked transfer encoding.
Pre-position the manifest and the first 60 to 90 seconds of every rendition in edge caches before publish, enable request coalescing so concurrent misses collapse into one origin fetch, and put an origin shield in front of storage. Those three together eliminate most synchronised-miss storms.
AV1 lowers the bitrate needed for a given quality, which helps constrained viewers, but hardware decode coverage is broad rather than universal as of 2026. Ship it as an additional ladder alongside H.264 and HEVC with capability-based selection, and measure rebuffer ratio per codec before shifting default weight.
Pick your top-viewed title. Pull segment TTFB at p50, p95 and p99, split by edge region and by hit versus miss. If p95 miss TTFB is more than 5× your p95 hit TTFB, your buffering problem is a caching problem and no encoding change will fix it. Then check your lowest rendition: if it sits above 500 Kbps, add a floor rung and rerun rebuffer ratio for the bottom throughput decile of your audience over a full week.
If you have measured something that contradicts the thresholds above — particularly around segment duration or ABR estimator tuning — that is the conversation worth having. Bring the numbers and we will compare notes against ours.

Heavy traffic.
Light bill.
The CDN for video and large traffic
Learn
Lossy vs lossless compression comes down to one trade: lossless compression rebuilds every original bit and typically ...
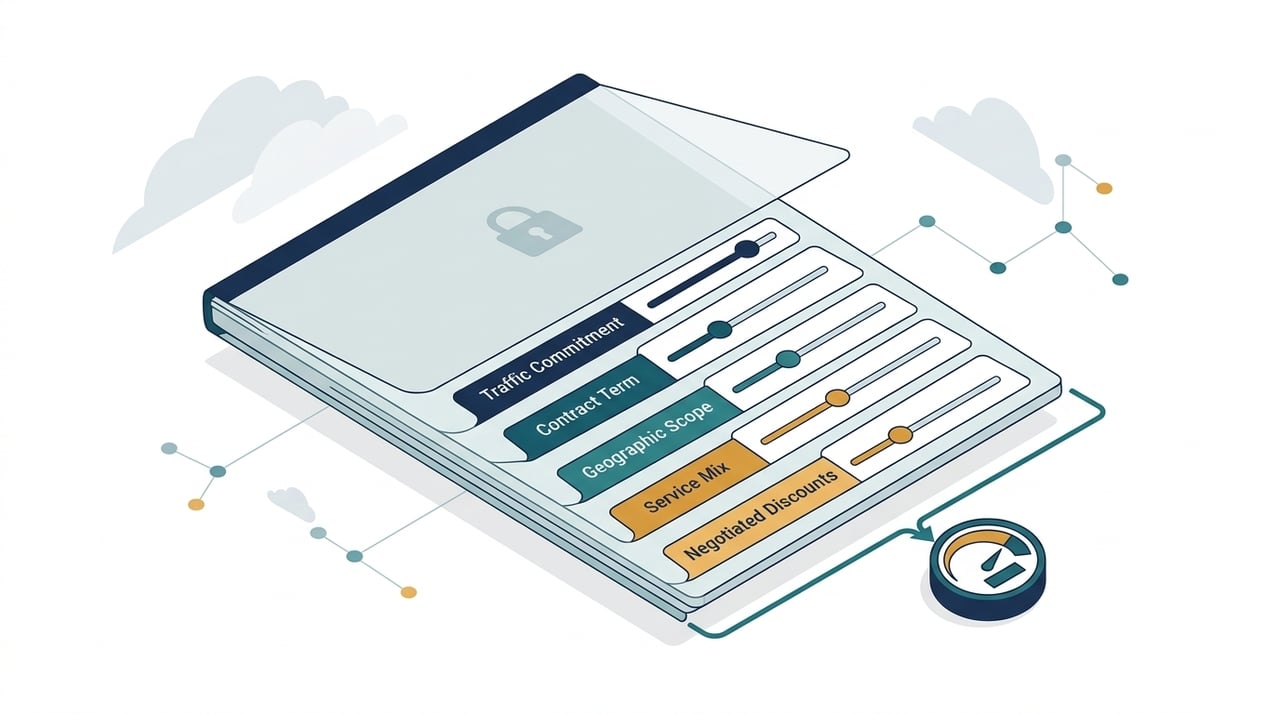
Pricing - Pricing & Costs
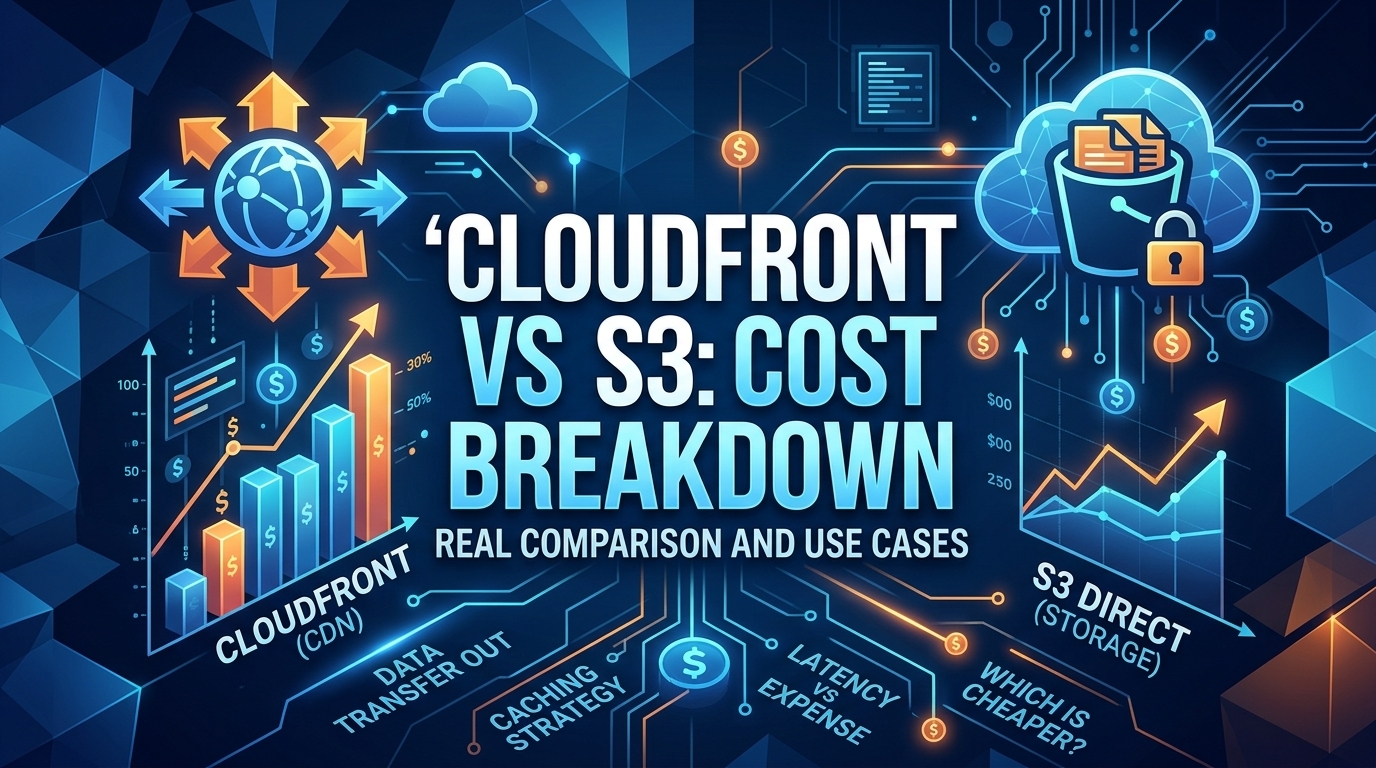
The CloudFront vs S3 decision depends more on object size than on traffic volume. At a 500 KB average response, 100 TB ...
Learn
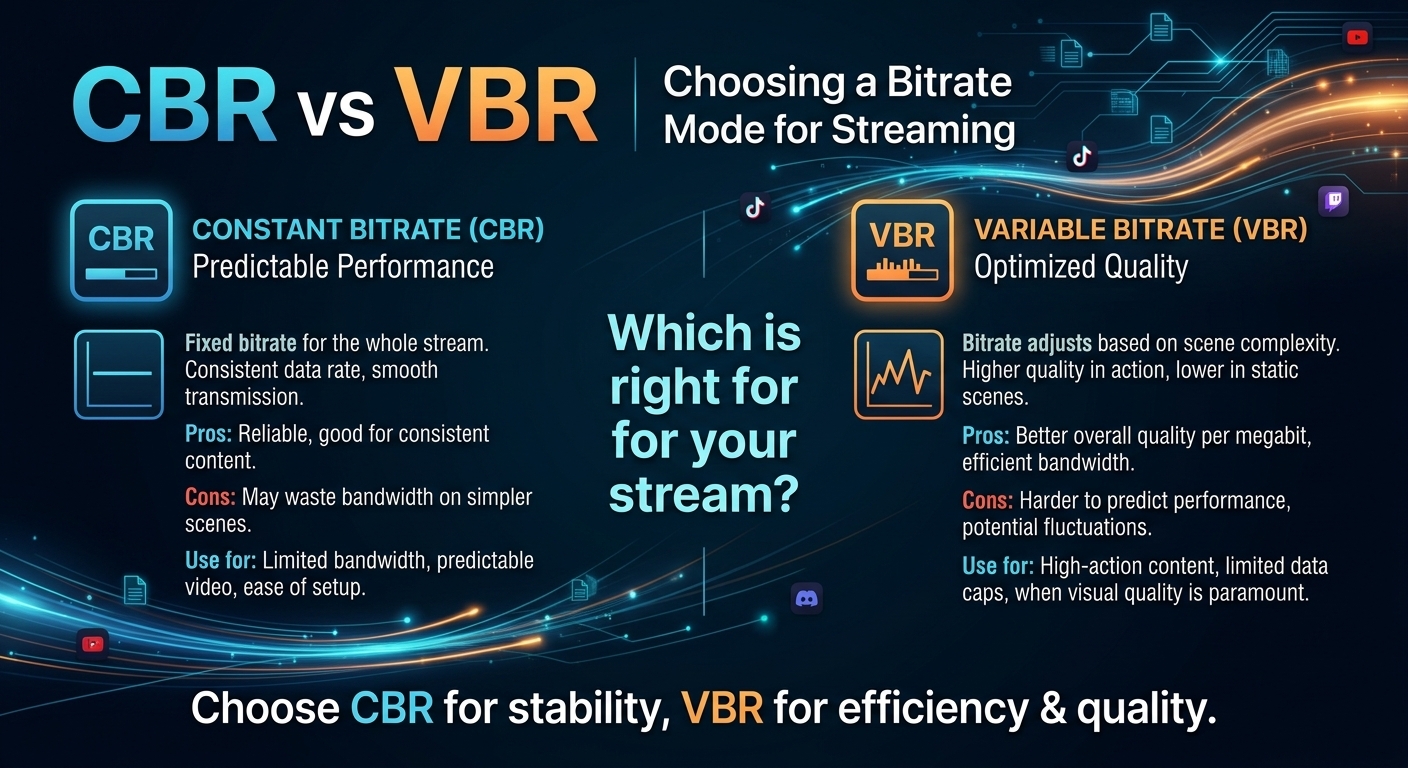
For most on-demand video, capped variable bitrate (VBR) wins the cbr vs vbr decision: it spends bits where the picture ...