
Learn
How a Multi-CDN Strategy Saved Us from Costly Downtime
In a recent survey, 60% of enterprises reported that a single hour of critical-application downtime costs them at least ...
A 100-millisecond delay in page load can drop conversion rates by up to 7%, according to Akamai’s "State of Online Retail Performance" report (source). Yet in many enterprise teams, performance conversations still focus on frontend frameworks, tracking scripts, or design tweaks — while the Content Delivery Network (CDN) quietly sits in the background, untouched for years.
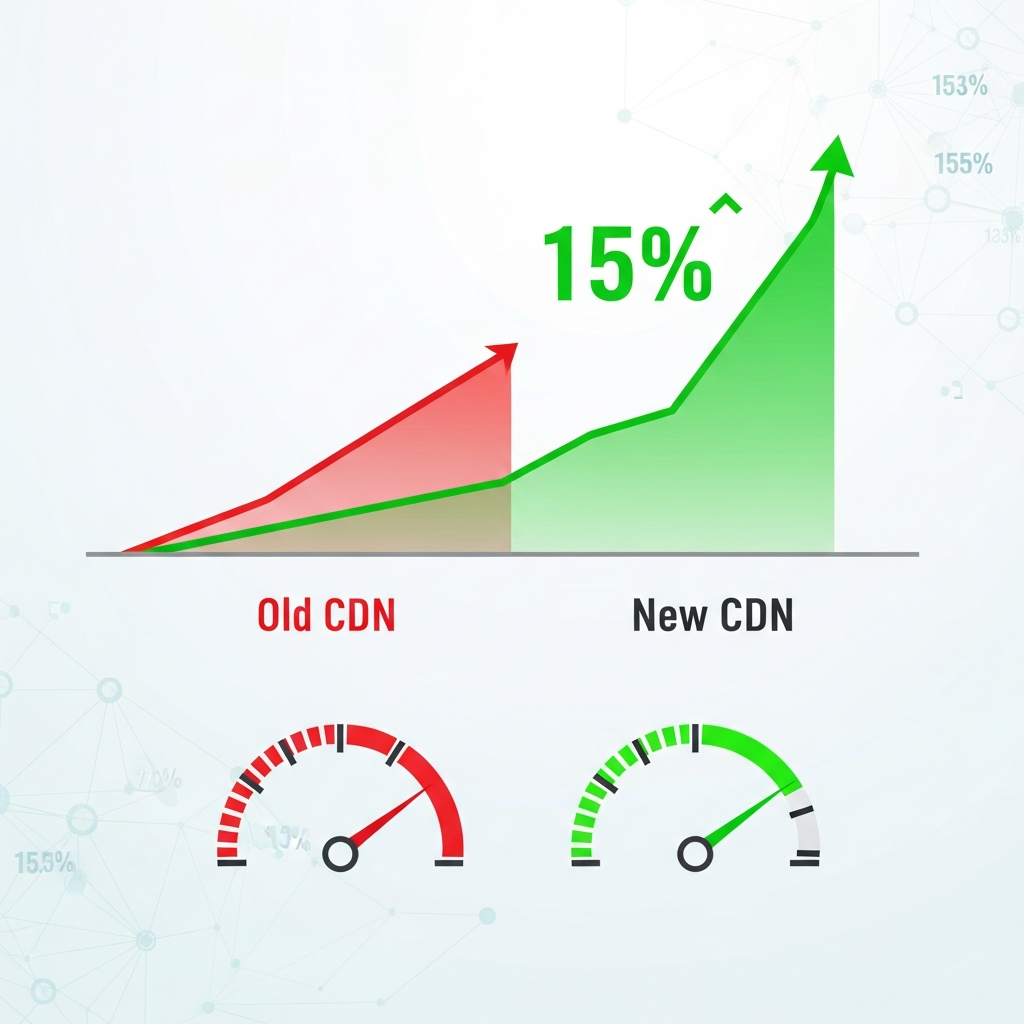
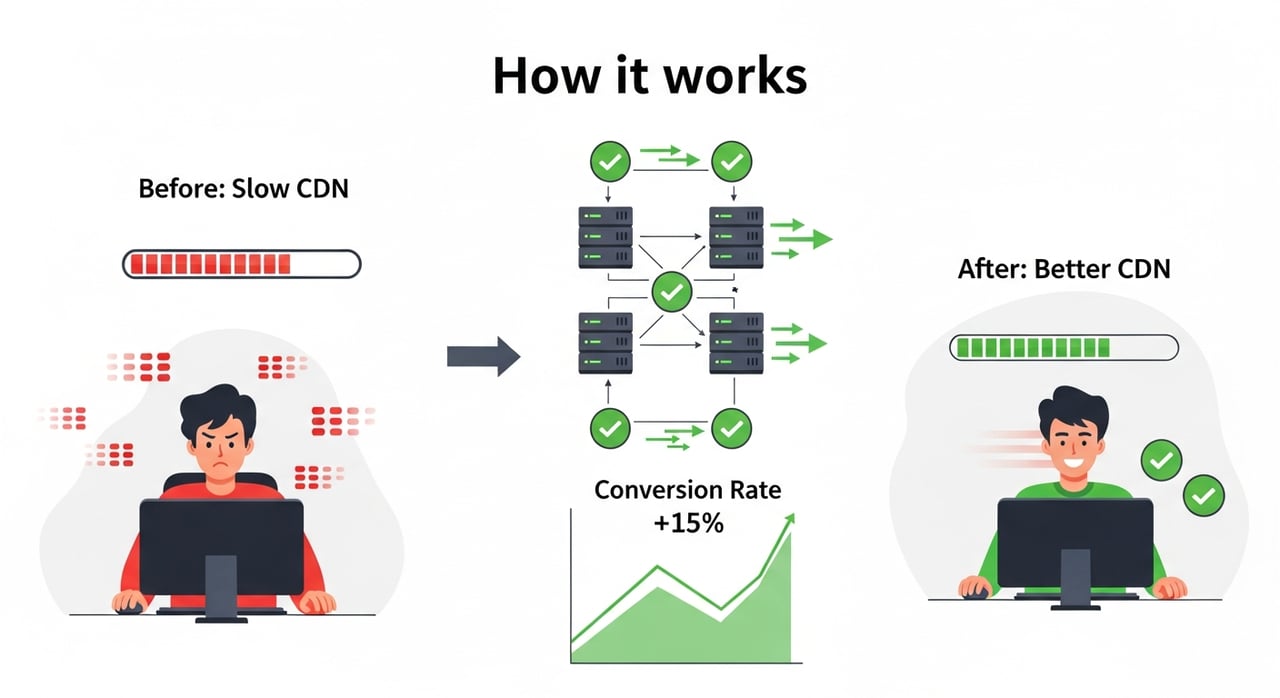
When we optimized and then replaced an underperforming CDN for a large, globally distributed ecommerce program, we saw a 15% uplift in conversion rate without changing a single pixel of the UI. This case study walks through exactly how that happened — the diagnostics, the migration, the specific optimizations, and the business impact — so you can apply the same approach to your own stack.
As you read, ask yourself: if your CDN is treated as "set and forget," how much revenue could be trapped behind milliseconds of invisible latency?
Most teams agree that faster websites convert better, but the scale of that impact is often underestimated — especially for enterprises with heavy traffic and complex infrastructure.
Independent research consistently shows a tight link between speed, engagement, and revenue:
Behind many of these performance issues lies an outdated or poorly tuned CDN configuration. Common problems include:
All of these directly influence the user journey: slower product pages hurt add-to-cart rates, sluggish checkout pages increase abandonment, and laggy dynamic content breaks trust.
Before we dive into the 15% conversion lift, take a moment: do you know your current median TTFB, or cache hit ratio, in your top three markets — and how they correlate with conversion rate?
The case we’ll unpack is drawn from a real engagement with a global ecommerce program operating across North America, Europe, and parts of Asia. The brand sells high-margin products where a 1–2% change in conversion rate materially impacts millions in annual revenue. While we can’t disclose the brand, the patterns and techniques are directly applicable to any high-traffic site: retail, SaaS, media, or gaming.
Before touching the CDN, we established a clear baseline across three key dimensions:
Here’s a simplified snapshot of the "before" state for the core ecommerce funnel (global average):
| Metric (Global Avg) | Before CDN Optimization |
|---|---|
| Median TTFB | 650 ms |
| Median LCP (Product Page) | 3.8 s |
| Cache Hit Ratio (Static Assets) | 78% |
| Checkout Completion Rate | 52% |
| Overall Conversion Rate | 2.4% |
Mobile users in distant regions bore the brunt of the latency. In some Asian markets, TTFB exceeded 1,000 ms and LCP climbed above 5 seconds. Paid campaigns performed particularly poorly in these regions, with high bounce rates and weak ROAS.
From analytics and RUM data, it was already clear: performance issues were shaving meaningful revenue off the table. What wasn’t clear yet was how much of that drag came specifically from the existing CDN.
In the next section, we’ll look at how we isolated the CDN as a primary bottleneck and built a performance diagnosis that the business and engineering teams could rally around.
Ask yourself: if you pulled similar baseline metrics today, could you trace where every millisecond of user-visible delay originates — origin, CDN, or frontend?
Blaming the CDN for slowness is easy; proving it in a way that convinces stakeholders is harder. We treated this like any other performance investigation: measure, segment, and isolate.
The first step was to differentiate what happened at the origin from what the CDN added (or failed to remove). Using a combination of:
We broke TTFB into two main components:
The origin’s median processing time was a respectable ~180 ms for cached HTML and 250–300 ms for uncached dynamic HTML. But users in some markets were seeing 900–1,200 ms TTFB. The gap was largely attributable to inefficient routing, weak caching, and suboptimal TLS configuration at the CDN layer.
Next, we examined cache headers and hit ratios per content type:
Cache hit ratio varied wildly by region: in core markets it hovered around 80%, but in emerging markets it dropped closer to 60% — precisely where network conditions were already worst.
To connect performance with business outcomes, we built simple but powerful correlation views:
The picture was stark: sessions with TTFB under 400 ms converted at roughly 2.9%, while sessions with TTFB over 800 ms converted closer to 1.9%. Similar patterns showed up for LCP and checkout step drop-offs.
By now, the business team could see hard numbers: performance wasn’t just a technical concern; it was a revenue leak. And a major portion of that leak sat squarely in the CDN’s domain.
If you ran the same exercise on your stack, would your CDN emerge as a quiet hero — or as the hidden bottleneck draining your marketing budget?
Once we had evidence, the next step was clear: migrate to a modern, better-optimized CDN and use the opportunity to redesign how content was delivered. This wasn’t a "lift-and-shift"; it was a strategic re-think of what the CDN should do for the business.
We approached the migration in three parallel tracks: configuration redesign, staged rollout, and continuous measurement.
The new CDN platform allowed more granular control over routing and transport-level optimizations. The key changes included:
These transport-level improvements alone shaved 80–120 ms off median TTFB in some regions, even before we touched caching logic.
Next, we redesigned caching with conversion and user experience in mind, not just bandwidth savings:
We also used cache-key normalization to prevent query-string and cookie noise from blowing up the cache. This significantly improved cache hit ratios in markets that previously looked "cold" from a CDN perspective.
Although the UI didn’t change visually, the way assets were delivered did:
These optimizations were implemented at the CDN layer, making them easier to roll out consistently across multiple applications without requiring deep code changes in each team.
To avoid surprises, we rolled out the new CDN configuration gradually:
Within a few weeks, 100% of traffic had migrated to the new CDN configuration, with multiple iterations of tuning based on live data.
Here’s how the key metrics evolved after the migration and optimization work:
| Metric (Global Avg) | Before | After CDN Optimization |
|---|---|---|
| Median TTFB | 650 ms | 360 ms |
| Median LCP (Product Page) | 3.8 s | 2.4 s |
| Cache Hit Ratio (Static Assets) | 78% | 94% |
| Checkout Completion Rate | 52% | 58% |
| Overall Conversion Rate | 2.4% | 2.76% (+15%) |
The 15% conversion lift didn’t appear overnight; it emerged over a controlled period of testing and rollout, which we’ll unpack next. But at this point we had what many teams are missing: a clear, measurable performance improvement tightly coupled to CDN changes.
Looking at your own stack, if you swapped "Before" for your current metrics, how far would you be from a similar "After" — and what’s the revenue delta between those two columns?
Improved metrics are great, but leadership cares about revenue and business outcomes. To make a credible claim that a better CDN improved conversion rate by 15%, we needed robust experimentation and attribution.
Instead of flipping all traffic to the new CDN at once, we used a controlled A/B testing approach:
Both groups saw the same UI, content, and pricing. The only difference was the delivery path. We ran the test until we reached strong statistical significance across major markets and traffic sources.
Results were consistent:
Digging deeper, we found that certain segments benefited disproportionately:
In some performance-sensitive markets, mobile conversion improved by more than 20%, even though the global blended uplift was 15%.
Beyond immediate conversion uplifts, we observed knock-on benefits:
Once stakeholders saw that a CDN change could simultaneously improve user experience, conversion, SEO, and infrastructure costs, the narrative around "CDN as a strategic lever" finally clicked.
Imagine running an A/B test where the only change is your CDN configuration — would you expect a double-digit conversion lift, or would you be surprised to see how much performance still lives in the delivery layer?
While every infrastructure stack is unique, the process that led to a 15% conversion improvement is repeatable. Here’s a condensed playbook you can adapt to your own environment.
This will help you build a data-backed story: "For users seeing TTFB over 700 ms, conversion is X% lower," which is far more persuasive than general statements like "we need to be faster."
Conduct a focused CDN health check:
Document which issues stem from configuration (fixable), from platform limitations (may require migration), or from origin bottlenecks (parallel workstream).
Instead of treating CDN as a generic bandwidth saver, design it specifically to support your revenue goals:
Not all CDNs are equal when it comes to conversion-focused workloads. Enterprises need:
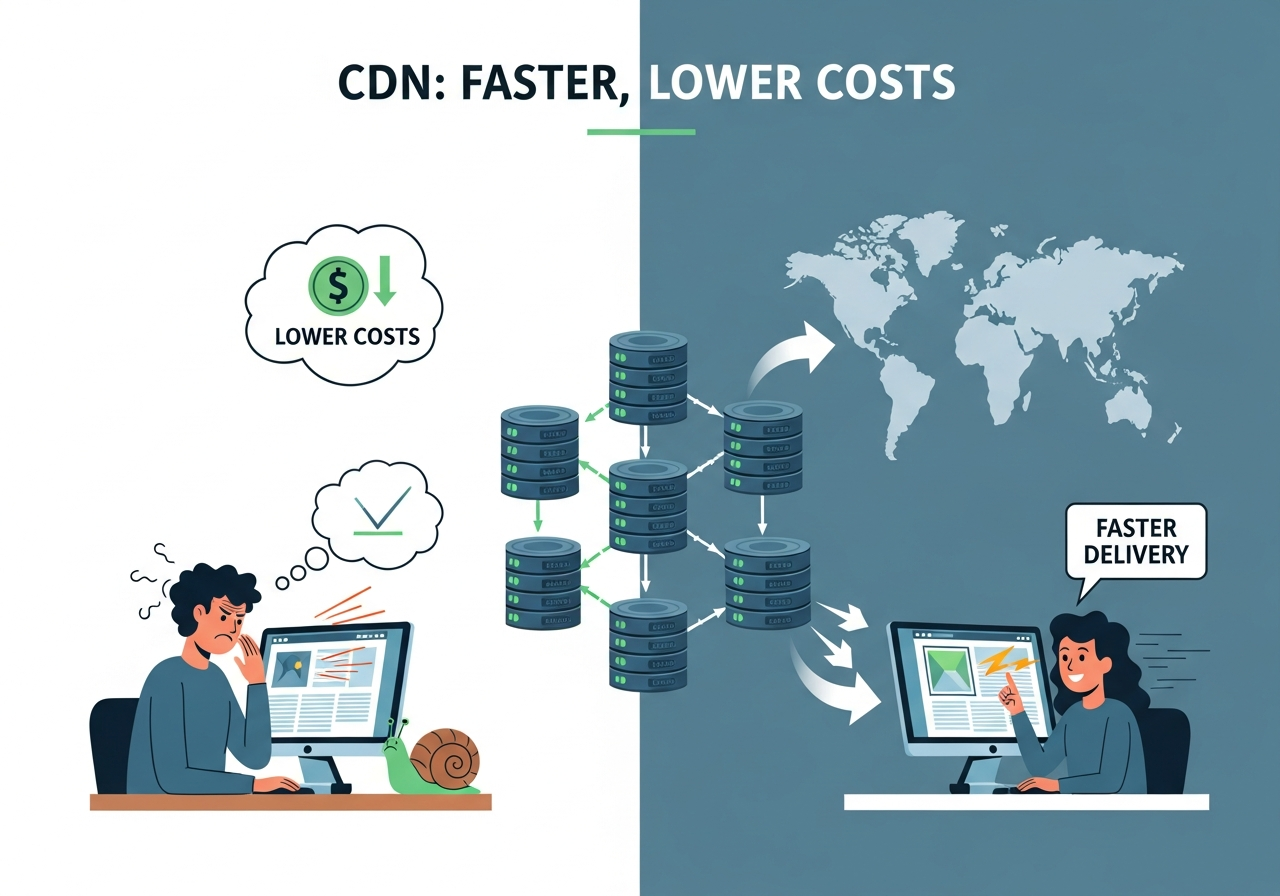
This is where modern providers like BlazingCDN stand out. Designed for demanding use cases in ecommerce, SaaS, media, and gaming, BlazingCDN offers 100% uptime, advanced performance features, and stability and fault tolerance on par with Amazon CloudFront — but at a significantly more cost-effective rate, starting from just $4 per TB ($0.004 per GB). For large enterprises, that pricing delta can free up six or seven figures annually that can be reinvested into growth instead of raw delivery costs.
Before you renew any CDN contract, ask: is this provider helping me win on performance and margin, or is it just a sunk infrastructure cost?
For organizations where every basis point of conversion matters — high-volume ecommerce, subscription-based SaaS, streaming platforms, and online games — choosing the right CDN is a strategic decision, not just a technical one.
BlazingCDN is built for these exact scenarios. It delivers the kind of stability and fault tolerance enterprises expect from incumbents like Amazon CloudFront, but with a leaner pricing model that starts at $4 per TB. That combination of reliability and price efficiency is particularly powerful for companies with large traffic footprints or global audiences.
Enterprise teams use BlazingCDN to:
Because BlazingCDN is already trusted by enterprises that care deeply about both reliability and efficiency, it has become a forward-thinking choice for teams that don’t want to compromise between performance and cost. If you’re evaluating how a better CDN could contribute directly to your own KPIs, exploring the BlazingCDN pricing model is often an eye-opening starting point.
As you think about your next quarter’s goals, what would it mean if your CDN could simultaneously improve user experience, strengthen margins, and make your infrastructure roadmap simpler instead of more complex?
A 15% conversion lift sounds big, but the path to get there is made up of small, disciplined steps. Here’s a 90-day roadmap you can adapt to your own organization.
By the end of this period, you won’t just have a faster site; you’ll have a clear, data-backed understanding of how CDN performance affects your bottom line. And you’ll have established a repeatable loop where CDN configuration becomes a lever you can pull deliberately — not a static piece of plumbing you tolerate.
So here’s the challenge: in the next week, pull one report that correlates performance metrics (like TTFB or LCP) with conversion rate for a key flow — and share it with your team. Once you see the pattern, you’ll never look at your CDN as "just infrastructure" again.
The 15% conversion lift we’ve walked through wasn’t magic — it was the compound effect of better routing, smarter caching, leaner payloads, and a CDN platform that could keep up with enterprise demands. Every one of those levers is available to you today.
If you’re serious about squeezing more revenue out of your existing traffic, start by questioning the quiet assumptions in your delivery stack: is your CDN truly optimized for speed, stability, and cost — or is it just the one you happened to choose years ago?
Review your performance data, challenge your current provider, and consider testing a modern alternative like BlazingCDN in parallel. Then share your findings with your peers, your team, or even in the comments of this post — because the more we treat CDN performance as a core part of growth strategy, the less revenue we’ll all leave trapped in milliseconds.
Your next 15% conversion lift might not come from a redesign or a new campaign. It might come from finally putting your CDN to work.
Learn
In a recent survey, 60% of enterprises reported that a single hour of critical-application downtime costs them at least ...

Learn
When Deloitte analyzed billions of user sessions for major retailers, they found that shaving just 0.1 seconds off ...
Learn
Every extra second your site takes to load can drop mobile conversions by up to 20%—that’s the stark finding from a ...