

Learn
What Is H.264 (AVC)? The Codec Behind Most Online Video
H.264, also called Advanced Video Coding (AVC) or MPEG-4 Part 10, is a block-based video compression standard published ...

You can prove what your CDN is actually caching in about 20 minutes with nothing but curl and a terminal. Send the same request twice, three seconds apart, and compare the curl headers: if the Age value climbs by roughly three and the cache status header flips from MISS to HIT, the edge served the second response from cache. If Age stays at 0 across ten requests, nothing is being cached, whatever the dashboard says. This playbook gives you the exact commands to debug cache headers, read the curl result correctly, and calculate the TTL your objects really have.
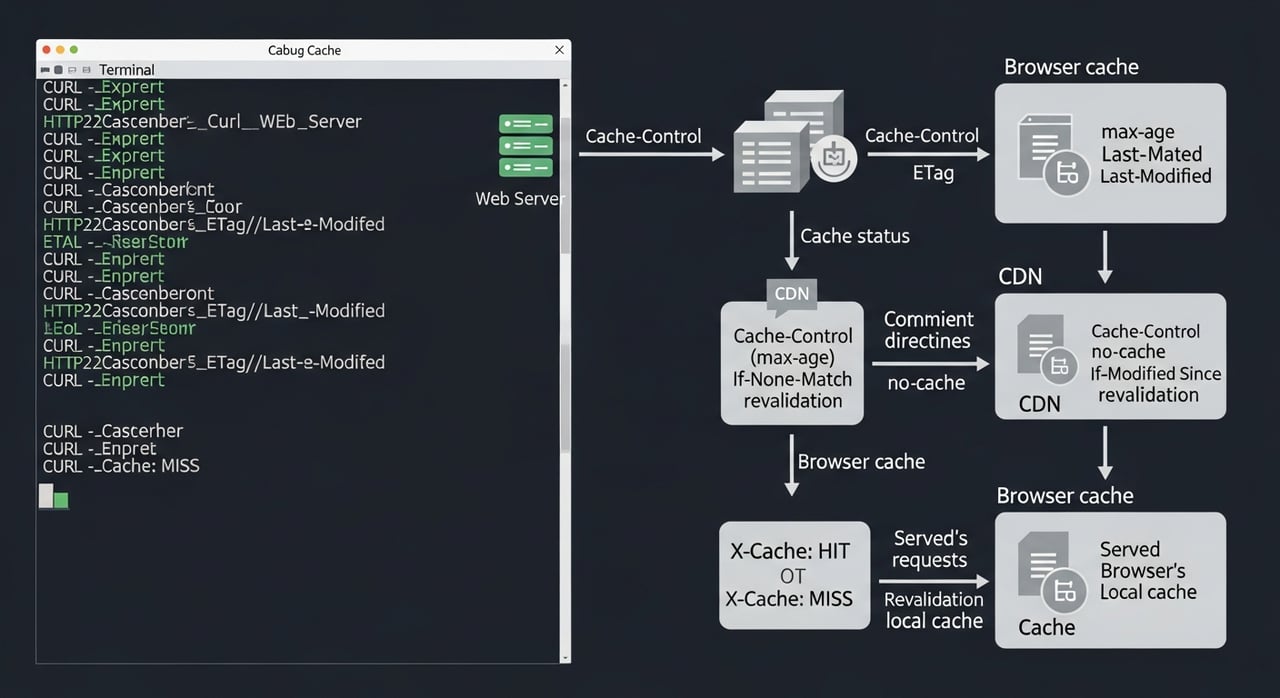
Substitute EXAMPLE_DOMAIN with your hostname and EDGE_IP with an address your hostname resolves to. Nothing else needs editing.
curl -sS -D - -o body.bin https://EXAMPLE_DOMAIN/assets/app.jsThe -D - flag dumps response headers to stdout while -o sends the body to a file. You get the status line, every response header, and no 400 KB of minified JavaScript in your scrollback.
Cache status header names are not standardized. Scan the curl result for x-cache, x-cache-status, cf-cache-status, cdn-cache, or x-served-by. Values are usually HIT, MISS, EXPIRED, REVALIDATED, BYPASS or DYNAMIC. BYPASS and DYNAMIC are the interesting ones: they mean a rule explicitly disqualified the object, not that the cache was cold.
Also record Cache-Control, Age, ETag, Last-Modified, Vary, and any Set-Cookie. Those six headers explain almost every caching bug you will hit.
curl -sS -D - -o body.bin https://EXAMPLE_DOMAIN/assets/app.js
sleep 3
curl -sS -D - -o body.bin https://EXAMPLE_DOMAIN/assets/app.js
The HTTP Age response header, defined in RFC 9111, is the most portable proof of a cache hit across CDNs: if two curl requests sent three seconds apart return Age values that differ by roughly three, the second response came from a stored copy rather than the origin. As of 2026 the vendor-specific status header names still differ (x-cache, cf-cache-status, x-cache-status), but Age is standard and behaves the same everywhere.
Read Cache-Control from the curl headers. If s-maxage is present, it overrides max-age for shared caches, and max-age applies only to the browser. Remaining edge TTL is s-maxage minus Age. An object with s-maxage=86400 and Age: 82800 has 1,400 seconds left, which is why your 5-minute test loop showed a sudden MISS.
If Age keeps growing past s-maxage while the status header reads HIT, you are being served stale content under stale-while-revalidate or stale-if-error. That is usually correct behavior, not a bug.
curl -sS -D - -o body.bin --resolve EXAMPLE_DOMAIN:443:EDGE_IP https://EXAMPLE_DOMAIN/assets/app.jsWithout --resolve, consecutive requests can land on different nodes, and a cold second node returns MISS even though caching works perfectly. This single flag removes the most common false negative in CDN debugging.
curl -sS -D - -o body.bin -H 'Accept-Encoding: br' https://EXAMPLE_DOMAIN/assets/app.js
curl -sS -D - -o body.bin -H 'Accept-Encoding: gzip' https://EXAMPLE_DOMAIN/assets/app.js
Each encoding is a separate cache entry when Vary includes Accept-Encoding. That is fine. Vary on User-Agent or on a cookie header is not: it fragments one object into thousands of variants and drives hit ratio toward zero. If you see Vary listing anything beyond Accept-Encoding, you have found your problem.
curl -sS -D - -o body.bin -H 'If-None-Match: "ETAG_VALUE"' https://EXAMPLE_DOMAIN/assets/app.jsPaste the ETag from step 1, quotes included, into ETAG_VALUE. A correct stack answers 304 Not Modified with no body. A 200 means the ETag is not surviving the edge, often because compression rewrites it without marking it weak, and every revalidation becomes a full origin transfer.
If all five hold on a pinned node, the object is cached and you can stop guessing.
Remove any cache-busting parameters you added to the test URL, purge the single object you dirtied, and revert temporary origin header changes before you walk away. If you added a debug header at the origin to trace requests, delete it in the same commit that added it. Leaving a Cache-Control: no-store on one path is a quiet way to double your origin egress for a month.
| Symptom in the curl result | Likely cause | Fix |
|---|---|---|
| Age always 0, status always MISS | Set-Cookie on the response, or Cache-Control private / no-store | Strip Set-Cookie for static paths at the origin; send public with s-maxage |
| MISS on every second request, HIT occasionally | Requests landing on different edge nodes | Repeat with --resolve pinned to one address |
| HIT with HEAD, MISS with GET | HEAD served from a separate or synthesized entry | Test with GET plus -o only; treat HEAD results as advisory |
| Conditional request returns 200, never 304 | ETag rewritten by edge compression, or dropped entirely | Emit weak ETags, or fall back to Last-Modified validation |
| Hit ratio collapses after a deploy | Query parameters or a new header included in the cache key | Normalize the cache key: ignore marketing parameters, sort the rest |
Most reported caching failures are not TTL problems at all: they are cache key and Set-Cookie problems that a two-request curl test surfaces in under a minute.
for n in 1 2 3 4 5 6 7 8 9 10
do
curl -sS -o body.bin -w "%{http_code} ttfb:%{time_starttransfer}s total:%{time_total}s\n" --resolve EXAMPLE_DOMAIN:443:EDGE_IP https://EXAMPLE_DOMAIN/assets/app.js
sleep 1
done
Time-to-first-byte separates a genuine edge hit from a warm origin. On a pinned node in 2026 measurements, an edge hit typically returns TTFB in the 5 to 40 ms range from a nearby client, while an origin fetch through the same edge usually lands between 80 and 400 ms depending on origin distance. A status header claiming HIT alongside a 250 ms TTFB deserves a second look.
curl -I sends HEAD, and some edges answer HEAD from metadata, synthesize it from a stored object, or forward it to origin regardless of cache state. The curl headers look authoritative and describe an object nobody actually served. Use GET with the body discarded to a file. It costs bandwidth and buys truth.
curl gives you one client, one node, one moment. It cannot report fleet-wide hit ratio, tell you whether a shield tier absorbed the miss, or show how many distinct cache keys one URL generates across real user traffic. For those you need CDN logs and origin request counts, and the honest trade-off is that curl will happily show a clean HIT while your global hit ratio sits at 60% because of key fragmentation you cannot see from one terminal.
When the headers are provably correct and the edge still misses, the remaining variable is configuration: how the CDN builds its cache key and whether you can override TTL per path. BlazingCDN exposes per-path cache rules and cache key control, which makes the Age arithmetic above a direct verification of the rule you just changed rather than a guess; the specifics are listed in the CDN cache control and TTL feature reference.
Send the same GET request twice a few seconds apart and compare the Age header in the curl result. A hit returns a non-zero Age that increases at wall-clock rate, usually alongside a vendor header reading HIT. Pin both requests to one edge address with --resolve, otherwise a second, colder node will report a false MISS.
Because Cache-Control is only one input to the caching decision. A Set-Cookie header on the response, a Vary header listing a high-cardinality field, an Authorization request header, or a cache key that includes query parameters will each prevent storage regardless of a valid max-age. Check those four before touching TTL values.
max-age sets the freshness lifetime for all caches, while s-maxage overrides it for shared caches such as CDNs and proxies and is ignored by browsers. A common production pattern is a short max-age for clients and a long s-maxage for the edge, giving fast invalidation at the browser and high edge hit ratio at the same time.
Yes, if your curl build includes HTTP/3 support: add the --http3 flag and the same header inspection applies. Caching semantics are transport-independent per RFC 9111, so Age, Cache-Control and ETag behave identically. What changes is connection setup timing, which affects TTFB comparisons but not whether an object was stored.
Pick your single highest-traffic static asset, pin it with --resolve, and run the ten-request loop. Write down four numbers: cache status on request one, Age on request two, remaining TTL from s-maxage minus Age, and median TTFB across the ten. If Age never moves, you just found origin traffic you are paying for twice. If it moves but TTFB stays above 100 ms, you have a routing question, not a caching one. Both answers take under five minutes and neither requires a dashboard.

Heavy traffic.
Light bill.
The CDN for video and large traffic
Learn
H.264, also called Advanced Video Coding (AVC) or MPEG-4 Part 10, is a block-based video compression standard published ...

Compare
At 100 TB a month, the published price gap between options for a CDN for static content is more than 16 times: ...

Learn
Evaluated October 2026: in the h264 vs h265 decision, HEVC (H.265) matches H.264 (AVC) quality at roughly 30 to 50 ...