
Learn
Video Quality Metrics: VMAF, PSNR and SSIM Explained
VMAF, PSNR and SSIM are the three video quality metrics most streaming teams run in encoding pipelines, and each ...
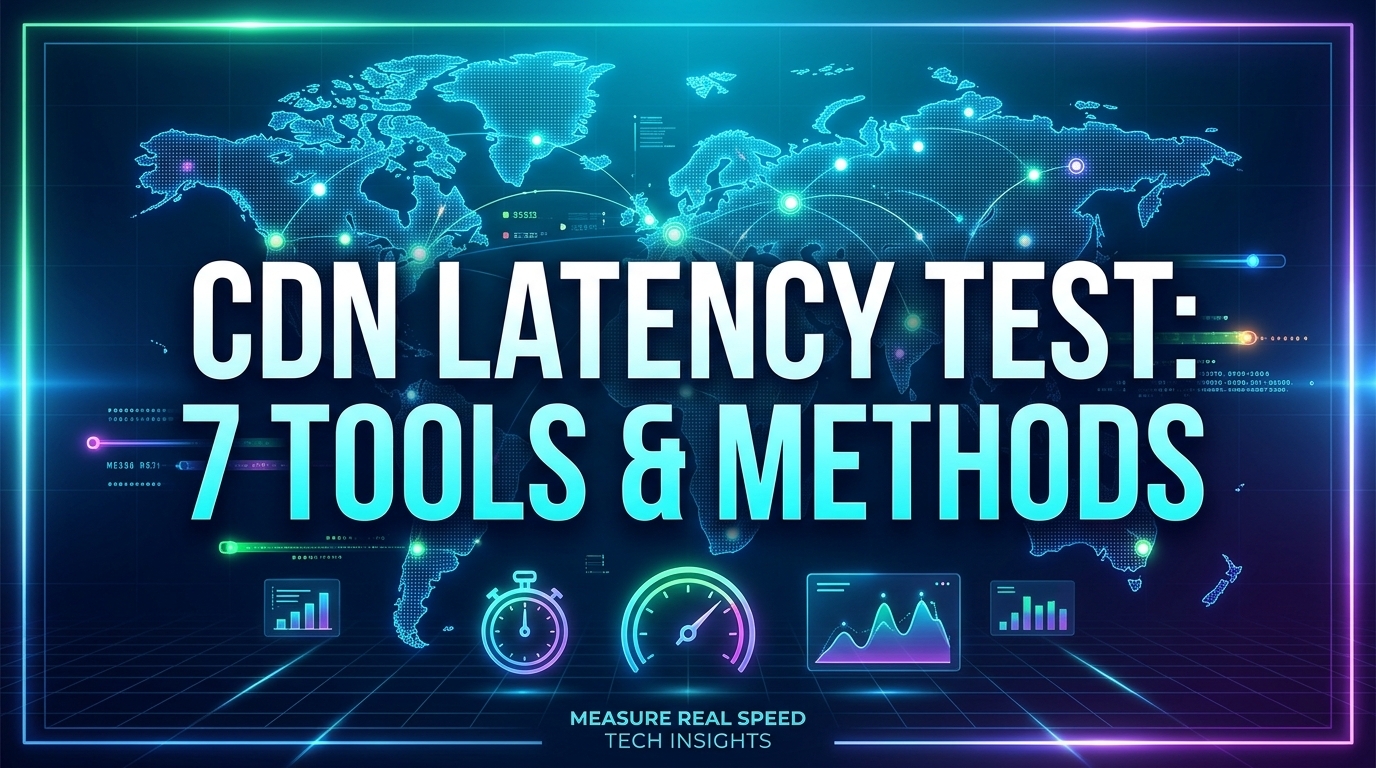
A CDN latency test built around one global median will report healthy numbers while a single region fails. On a cold HTTPS connection with TLS 1.3, time to first byte (TTFB) costs at least three network round trips before any cache logic runs. That is why a 2026-grade test measures round-trip time (RTT) and TTFB separately, per region, at p75 and p95, for cache hits and cache misses. This playbook gives you seven tools compared in one table, a seven-day test methodology with sample-size math, a worked TTFB budget, regional guardrails, and a results format you can reuse.
A trustworthy CDN latency test separates network round-trip time from time to first byte, because with TLS 1.3 a cold HTTPS request spends three round trips (TCP handshake, TLS handshake, request and response) before the first byte arrives. As of 2026, that means a 30 ms RTT produces a cold-connection TTFB of 90 ms or more even when the object is already cached at the edge.
Blended medians are dominated by your largest markets. If 70% of probes sit in North America and Western Europe, a 120 ms regression in Southeast Asia barely moves the global p50. The per-region tail is what users in those markets actually feel.
Small TTFB gaps also compound. A page that fetches a dozen render-blocking assets over two or three connections pays connection setup per connection and TTFB per serialized request, so a 40 ms regional gap can push Largest Contentful Paint out by several hundred milliseconds. The fix is structural: report every metric per region, per object class, per cache state.
RTT is the network round trip between client and edge, measured by ICMP probes or TCP handshake time. TTFB is the time from request start until the first response byte, and it includes RTT multiples plus DNS, TLS and server processing. RTT tells you about routing and distance. TTFB tells you what the user waits for.
Tool definitions differ, which ruins comparisons. Command-line HTTP timers usually report time-to-first-byte from the start of the transfer, including DNS, connect and TLS. Browser Resource Timing exposes responseStart, and many dashboards compute TTFB from requestStart, which excludes connection setup. Pick one definition, write it in your results schema, and never mix sources in one chart. The web performance guides on TTFB and RTT cover each metric in more depth.
| Tool | What it measures | Vantage points | Cost model | Blind spot |
|---|---|---|---|---|
| Catchpoint | HTTP timing phases, DNS, traceroute | Backbone, last-mile, cloud nodes worldwide | Quote-based | Backbone nodes look better than real users |
| ThousandEyes | Path visualization, BGP, loss per hop | Cloud and enterprise agents | Quote-based | Weaker on cache-state analysis |
| Grafana Cloud Synthetic Monitoring | HTTP, DNS, ping, k6 browser checks | Public probes plus private probes | Usage-based, free tier available | Fewer probe locations than enterprise suites |
| Command-line HTTP timers | DNS, connect, TLS, first byte, total | Wherever you run them (CI, VMs) | Open source plus VM cost | Datacenter vantage only |
| mtr | Per-hop loss, latency, jitter | Any host you control | Open source | ICMP deprioritization creates false loss |
| WebPageTest | Full-page waterfalls, connection reuse | Global test agents, real browsers | Public tier plus paid API plans | Low sample counts per run |
| RUM (Performance API, web-vitals) | Real Resource Timing, LCP, TTFB | Every real user | Built into browsers plus collection cost | No cross-origin detail without Timing-Allow-Origin |
No single tool covers routing, cache state and real users at once, so a credible test pairs one synthetic source with RUM and keeps mtr for diagnosis.
Two details catch experienced teams. Browsers zero out DNS, connect and TLS phases for cross-origin CDN assets unless the response carries a Timing-Allow-Origin header, so your RUM looks fine while hiding the slow phase. And synthetic backbone probes skip the last mile, which is why RUM p75 is routinely worse than synthetic p75 in the same city.
To test CDN speed credibly, run synthetic probes from 12 to 15 regions every five minutes for seven days, fetching three object sizes in both warm-cache and cache-miss states, and record each timing phase separately. Then validate the synthetic p75 against RUM from the same regions before drawing conclusions.
With TLS 1.3, cold-connection TTFB is approximately DNS time plus three RTTs plus edge processing; on a reused connection it drops to one RTT plus edge processing. A cache miss adds the edge-to-shield round trip, the shield-to-origin round trip and origin processing, assuming upstream connections are kept alive.
Plug in an illustrative case: 20 ms client RTT, 15 ms DNS, 5 ms edge processing. Cold TTFB is 15 + 60 + 5 = 80 ms. Warm TTFB is 25 ms. Now add a miss with 10 ms to the shield, 60 ms to the origin and 40 ms of origin work: warm miss TTFB is 25 + 10 + 60 + 40 = 135 ms.
The non-obvious consequence is in the percentiles. At a 95% hit ratio, the mean is 0.95 × 25 + 0.05 × 135 = 30.5 ms, but p95 sits exactly on the boundary between the hit and miss distributions. A one-point drop in hit ratio can move reported p95 from about 25 ms to about 135 ms, a 5x jump, with zero network change. Always read tail latency next to hit ratio.
| Region (in-region probes) | Cached, warm connection | Cache miss, warm connection |
|---|---|---|
| North America | 15 to 35 ms | 80 to 150 ms |
| Western Europe | 15 to 30 ms | 70 to 140 ms |
| Southeast Asia | 25 to 50 ms | 120 to 220 ms |
| Latin America | 30 to 70 ms | 150 to 260 ms |
| Sub-Saharan Africa | 40 to 90 ms | 200 to 350 ms |
| Oceania | 20 to 45 ms | 120 to 250 ms |
These are this blog's 2026 guardrail estimates derived from the RTT budget above, and miss latency depends far more on where your origin sits than on the CDN.
Adjust the miss column for physical distance: light in fiber adds roughly 1 ms of RTT per 100 km, so an origin in Virginia serving Sydney through a shield starts above 150 ms before any processing.
Store one row per probe, region, object and cache state, with these fields: test window, region and probe ASN, object size class, cache state, connection state (cold or warm), protocol, sample count, p50, p75, p95 and p99 TTFB, IQR, median RTT, DNS and TLS medians, throughput for large objects, and observed hit ratio. Reject any row whose sample count is below the threshold for the percentiles it reports.
Compute each region's interquartile range (IQR), p75 minus p25. A wide IQR points to unstable routing, intermittent misses or connection churn. Flag any region whose IQR exceeds twice the median IQR across all regions.
Then decompose. If the variance lives in the TLS phase, look at session resumption and connection reuse. If it lives in TTFB after connect, look at cache state and shield routing. Bimodal distributions often mean two paths: inconsistent shield selection, or HTTP/3 clients falling back from QUIC to TCP when UDP is blocked.
Alert when a region's p75 breaches its guardrail for three consecutive windows, or when its IQR exceeds twice its rolling 30-day median.
Treat every CDN change (new provider, cache rule, shield location, DNS weight) as a canary. Shift 5% to 10% of traffic, compare per-region p75 and p95 against the previous seven-day baseline, and require the canary hit ratio to be within one point of the control.
A good cached TTFB from a CDN is roughly 15 to 35 ms at p75 on a warm connection in North America and Western Europe, and 25 to 90 ms in regions with sparser infrastructure. Cold connections add DNS plus two extra round trips with TLS 1.3, so always state which connection state your TTFB number describes before comparing.
A CDN latency test needs about 40 samples per probe and object for p75, 200 for p95 and 1,000 for p99, using the rule of ten samples beyond the percentile. Running probes every five minutes for seven days yields about 2,016 samples, enough for p99 and for catching weekly traffic patterns.
A CDN latency test should use both synthetic monitoring and real-user monitoring. Synthetic probes give controlled, repeatable measurements that isolate cache state and routing, while RUM shows last-mile reality across ISPs and devices. When RUM p75 is much worse than synthetic p75, the gap usually sits in the last mile or in connection setup.
CDN TTFB differs between tools because they start the clock at different points. Command-line timers usually include DNS, TCP and TLS, while browser dashboards often measure from requestStart, excluding connection setup. Probe location, connection reuse and whether the object was cached also change results, so compare only measurements sharing one definition and one cache state.
Test CDN latency on a cache miss by adding a unique query string or cache-busting header to a fraction of requests, then confirming the miss through the cache status header. Report miss TTFB separately from hit TTFB, since a miss includes edge-to-shield and shield-to-origin round trips plus origin processing time.
Pick your 12 to 15 regions, schedule five-minute probes against a 1 KB beacon, a representative asset and one large file, and tag every sample with cache state and connection state. After seven days, build the per-region table from the results format above, overlay hit ratio on p95, and flag any region whose IQR is twice the median. That report alone will tell you whether your problem is routing, caching or origin distance.
If you want a second endpoint for the same harness, BlazingCDN publishes a public test file and its measured June 2026 results (Europe 27 ms and 1.12 Gb/s, North America 24 ms and 1.11 Gb/s, Asia 47 ms and 761 Mb/s on a 100 MB HTTPS download) on its CDN performance metrics page.

Heavy traffic.
Light bill.
The CDN for video and large traffic
Learn
VMAF, PSNR and SSIM are the three video quality metrics most streaming teams run in encoding pipelines, and each ...

Pricing - Pricing & Costs
A cheap CDN in 2026 costs $415 to $1,000 for 100 TB of monthly delivery at published list prices, while hyperscaler ...