
Learn
How a Multi-CDN Strategy Saved Us from Costly Downtime
In a recent survey, 60% of enterprises reported that a single hour of critical-application downtime costs them at least ...

Up to 40% of viewers abandon an online video after the first 60 seconds of buffering, according to Akamai’s State of Online Video. For a subscription streaming platform, that isn’t just a UX problem — it’s churn, refunds, bad reviews, and broken business models.
This article walks through a real-world style case study of how a streaming platform can eliminate roughly 80% of buffering by moving to a dedicated video CDN architecture. We’ll dissect the before/after metrics, the architectural shifts, and the operational lessons that any OTT, live sports, or VOD service can apply — and we’ll highlight how modern providers like BlazingCDN make this transition faster, safer, and dramatically more cost-effective.
As you read, ask yourself: if you could cut buffering by even half, how much more would your marketing spend, content budget, and customer support efforts suddenly be worth?
Before any architecture change, there’s usually a familiar pattern: support tickets spike during peak events, Twitter fills with angry comments, and internal dashboards show “average buffering” in abstract percentages that don’t feel actionable.
Industry data makes the impact brutally clear:
Our “case study” pattern is based on the journey many mid-size platforms have shared publicly: a rapidly growing OTT service with millions of monthly viewers, a mix of live and on-demand content, and global traffic spikes during premieres or big matches. Their key problems looked like this:
This profile is not unique; it mirrors what many platforms see before they adopt a purpose-built video CDN strategy. The 80% buffering reduction we’ll walk through isn’t a miracle — it’s what happens when you re-architect delivery around how video actually behaves across networks, devices, and geographies.
If you pulled your last month of analytics, would your rebuffering rates and startup times look closer to the “before” metrics above than you’d like to admit?
Most streaming platforms don’t start with a dedicated video CDN. They grow into it after hitting scaling walls. Initially, the architecture often looks like this:
On paper, this seems fine: a CDN is a CDN, right? In practice, video behaves very differently from images or scripts:
In our archetypal platform, the symptoms of this mismatch showed up clearly:
The team tried to patch things: bumping instance sizes, tweaking cache TTLs, adding more origins. But without a delivery layer designed specifically for video, each fix solved one issue and created another.
Looking at your own stack, how much of your current CDN configuration is “video-aware” versus inherited from generic web performance playbooks?
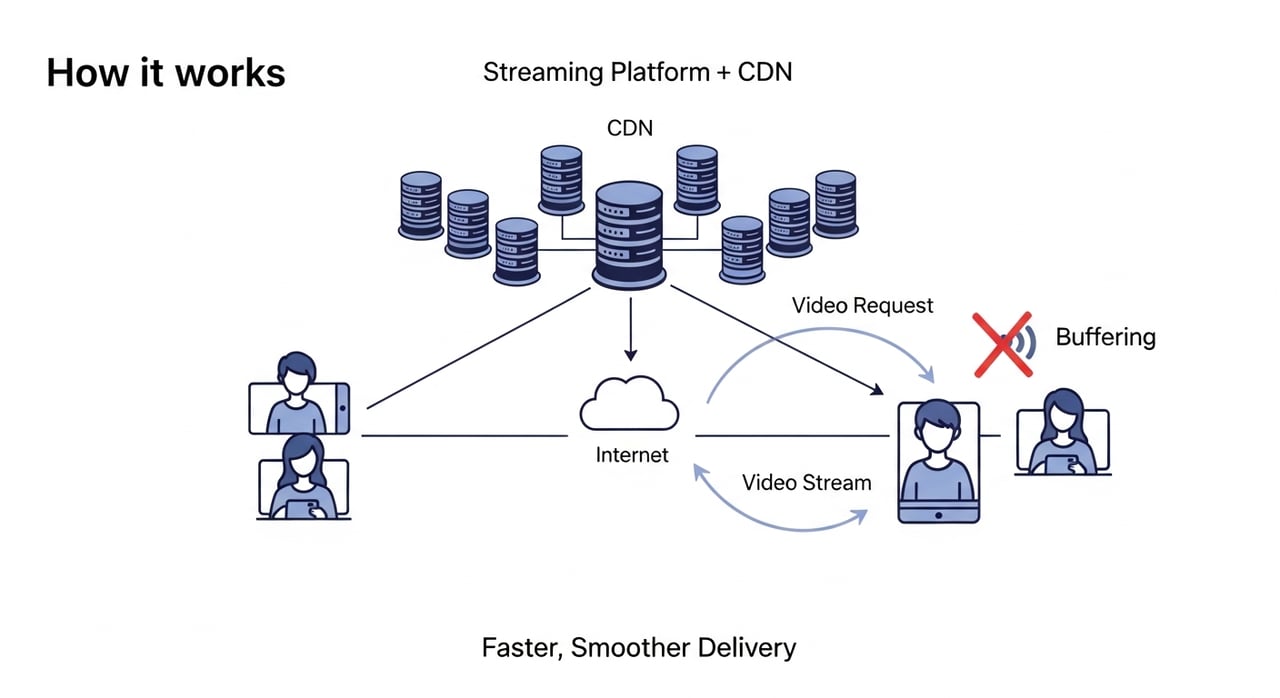
The turning point in our case pattern was the decision to move from a generic CDN setup to a video-optimized CDN strategy. A video CDN isn’t just a marketing term; it bundles capabilities tailored to the lifecycle of video segments and manifests.
Here are the capabilities that made the measurable difference:
Instead of treating video as “just more static files,” the platform’s new delivery layer understood the semantics of manifests and segments, aligning cache policy with how users actually watch.
When you look at your feature checklist for delivery partners, are you evaluating them as web CDNs or as video CDNs — and does your current provider really understand segment-level behavior?
The first critical step in the journey to 80% less buffering was measurement. Many teams track high-level player errors, but lack the granularity to tie buffering back to delivery decisions.
The platform’s engineering and video operations teams focused on three core metrics:
They also began to correlate these with delivery-side metrics:
Within a few weeks, a pattern emerged: whenever cache hit ratio for video segments dropped below ~90% in a region, rebuffering ratio spiked. Certain ISPs also showed highly variable throughput, causing aggressive bitrate oscillation and more stalls.
Armed with this data, the team could now quantify a goal: move from ~2.5–3% rebuffering ratio down below 0.5–0.7% on average — an 70–80% reduction, in line with what leading OTT and sports platforms report after modernizing their video delivery stacks.
If you plotted rebuffering ratio against cache hit ratio and regional latency for your platform today, would you see the same clear correlations — or are you still flying blind with only aggregate “play failures”?
With clear metrics, the platform could design a target architecture that aligned with how video traffic behaves under load. At a high level, the shift looked like this:
| Aspect | Before (Generic Delivery) | After (Video CDN-Centric) |
|---|---|---|
| Origins | Single cloud region serving all manifests and segments | Optimized origin layout with strategic replication for high-demand regions |
| CDN Configuration | Single CDN, generic cache rules for static assets and video | Video-optimized CDN configuration with manifest/segment-specific TTLs and cache keys |
| Visibility | Basic HTTP metrics, limited per-title QoE insight | Per-region, per-title QoE dashboards and alerting |
| Performance | Frequent origin saturation, uneven regional performance | High edge cache hit ratio, stable experience across geographies and ISPs |
On the CDN side, the change involved:
The immediate impact was visible in logs and bills: fewer origin hits per view, more efficient use of edge cache, and a rapid stabilization of peak load curves. But the real test would still be QoE — especially under real viewer load during high-stakes events.
If you separated your video delivery configuration from everything else today, what “hidden” cache and routing inefficiencies would that reveal overnight?
Simply turning on a video CDN isn’t enough; the 80% buffering reduction came from targeted, data-driven tuning over several release cycles. Below are the specific levers that moved the metrics.
For live streaming, the team focused on segment and manifest behavior:
For VOD, long-tail content was the challenge. Many titles saw sporadic traffic, making it easy for segments to fall out of cache. The solution involved:
These changes alone boosted cache hit ratios for video segments from the mid-80s to the mid- to high-90s in key regions, slashing origin round-trips that often turned into visible buffering.
Looking at your access logs, how many of your segments are actually served from cache during peak hours — and what would a 5–10 percentage point increase in cache hit ratio do to your rebuffering?
Users notice startup delay more acutely than almost any other performance issue. The team targeted TTFF on three fronts:
Across mobile networks, this optimization brought average startup time down from 4–6 seconds to around 2–3 seconds, a reduction of 40–50%. Combined with lower rebuffering during playback, the overall perceived smoothness improved dramatically.
If you opened your player’s dev tools right now, how many network round-trips does it take from clicking play to receiving the first media segment — and which of those trips could your CDN eliminate or shorten?
Even with a perfect CDN, last-mile conditions vary wildly. That’s where partnership between the player’s adaptive bitrate (ABR) logic and the CDN becomes crucial.
The platform’s team worked on:
With the CDN reliably delivering segments quickly and predictably, the player could maintain smooth playback at the highest sustainable bitrate per user, reducing mid-stream stalls dramatically.
Does your ABR ladder design consider how your CDN behaves under load, or was it set once by the encoding team and left untouched despite changes in networks and viewers?
Origin overload is a common hidden cause of buffering. When too many segment requests miss the cache and hit the origin, CPU and I/O contention can cause cascading delays.
The platform’s video CDN strategy included:
By reducing origin dependency and smoothing request patterns, the team eliminated many of the worst-case buffering events that previously occurred during big releases or matches.
In your last major live event, did your origin metrics stay flat and calm, or did you see CPU and I/O spikes that coincided perfectly with complaints about buffering?
After several months of iterative optimization on top of the video CDN, the platform’s KPIs looked markedly different. While numbers will vary by service, region, and content mix, the pattern is instructive.
| Metric | Before Video CDN Optimization | After Video CDN Optimization |
|---|---|---|
| Average rebuffering ratio | ~2.5–3% | ~0.4–0.6% (≈80% reduction at peak) |
| Peak-event rebuffering ratio | >5% in certain regions | ~1–1.2% |
| Average startup time (TTFF) | 4–6 seconds on mobile networks | 2–3 seconds on mobile networks |
| Edge cache hit ratio for segments | Mid-80s% | Mid/high-90s% in key markets |
| Origin egress costs | Growing faster than view hours | Flattened, then dropped per-view by 30–40% |
The most important feedback, however, didn’t come from dashboards. It came from viewers and business teams:
In the end, less buffering didn’t just mean fewer complaints — it meant more watch time, higher LTV, and more leverage in content negotiations.
If you projected even a modest 20–30% improvement in viewer retention from smoother playback, how would that change your willingness to invest in a modern video CDN strategy?
Beyond the technical changes, the case pattern reveals several strategic lessons that apply to any serious streaming operation.
Successful platforms treat their video delivery stack as a product with its own roadmap, KPIs, and stakeholders — not as a hidden service owned solely by infrastructure teams.
That means:
When your delivery KPIs appear on the same dashboards as revenue and churn, how differently do your conversations with leadership sound?
Video CDNs aren’t “set and forget”; they’re partners that you tune and evolve with. The best outcomes come when your teams and your CDN provider’s solution architects collaborate deeply on:
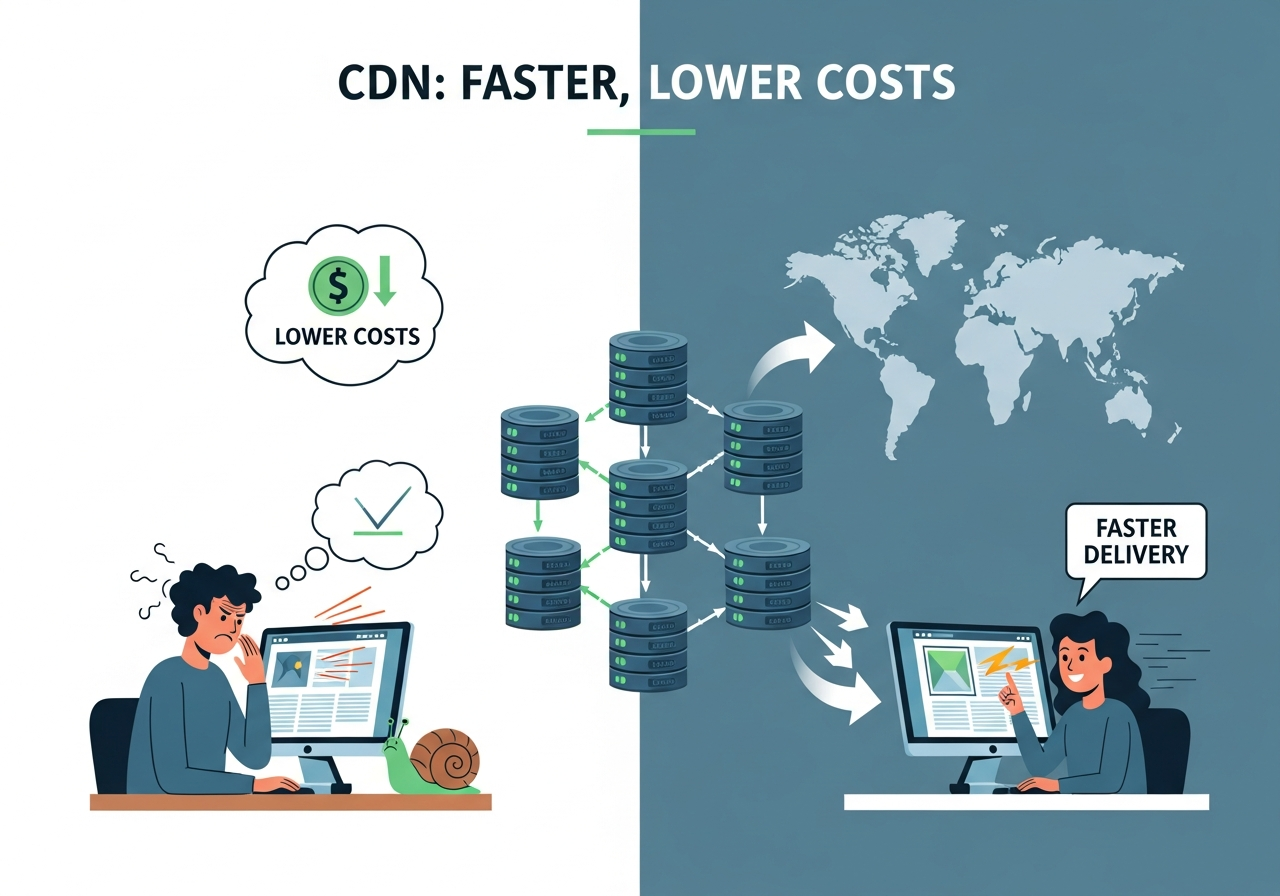
Platforms that treat their CDN as a commodity pipe often leave huge performance and cost savings on the table.
If you asked your current CDN to walk you through a tailored video optimization plan tomorrow, would they be ready — or would they just send you a generic documentation link?
Delivery optimization depends on visibility. The more granular your telemetry, the faster you can diagnose and fix issues before viewers notice.
Best-in-class platforms stitch together:
With this observability stack, you can quickly answer questions like: “Is this spike in buffering due to a new player release, a regional ISP issue, or a misconfigured cache rule?”
Right now, if buffering suddenly doubled for viewers on one mobile network in one country, how quickly could you pinpoint the root cause — minutes, hours, or days?
For media, OTT, and live streaming businesses, the right video CDN partner needs to combine three things: high performance, rock-solid reliability, and economics that scale with exploding view hours. This is where BlazingCDN is engineered to excel.
BlazingCDN is a modern, video-first CDN designed for enterprises that expect 100% uptime and predictable, low-latency delivery — with stability and fault tolerance on par with Amazon CloudFront, but at a fraction of the cost. With pricing starting at just $4 per TB (that’s $0.004 per GB), it gives streaming platforms the financial room to grow viewership without dreading their next infrastructure bill.
Because BlazingCDN is built for demanding workloads, it’s especially well-suited to media companies, OTT platforms, and live event broadcasters that need to scale quickly for premieres or matches, adjust configurations flexibly across regions, and keep rebuffering consistently low even under unpredictable spikes. Many forward-thinking global brands that care deeply about both reliability and efficiency have already made similar choices for their high-traffic digital properties.
If you’re evaluating how a video CDN can reshape your streaming economics and QoE, it’s worth seeing how features like intelligent caching, fine-grained configuration, and transparent pricing come together in practice at BlazingCDN’s solutions for media companies.
Looking at your roadmap for the next 12–18 months, will you be able to meet your quality and cost targets with your current delivery stack — or is it time to bring in a CDN partner designed for video at scale?
If you want to follow a similar path to slashing buffering (and costs), here’s a concrete checklist you can start working through this quarter.
By the end of this phase, you should have a clear picture of “where it hurts” the most and how much buffering is costing you in engagement and infrastructure spend.
This phase sets the technical and business goals that your CDN partner should help you meet or exceed.
Each iteration should be tied to measurable QoE changes. Over a few cycles, you’ll start seeing the kind of step-change reductions in buffering that this case study describes.
Which item on this checklist could you start this week with your current team — and which will require a strategic shift in how you work with your CDN provider?
Buffering isn’t an unavoidable tax on streaming; it’s a symptom of delivery architectures and configurations that haven’t yet caught up with how modern video is produced, distributed, and consumed. The experience of leading OTT, live sports, and VOD platforms shows that cutting buffering by 60–80% is achievable when you combine precise measurement, video-aware CDN capabilities, and iterative optimization.
If you recognize your own pain points in this case study — angry viewers during big events, inconsistent QoE across regions, origin bills that climb faster than your revenue — you’re exactly the kind of organization that benefits most from a modern video CDN approach.
Now is the moment to act: review your QoE metrics, map the biggest gaps, and start a serious conversation about how your delivery strategy needs to evolve. Share this article with your video engineering, product, and infrastructure leads, and use it as a blueprint for your next planning session. And when you’re ready to explore how a high-performance, 100%-uptime, video-optimized CDN with CloudFront-level reliability but far lower cost can fit into your stack, bring BlazingCDN into that discussion and see how much buffering, churn, and infrastructure spend you can take off the table.
What’s stopping you from making your next big live event or series launch the moment your viewers finally stop talking about buffering — and start talking about your content instead?
Learn
In a recent survey, 60% of enterprises reported that a single hour of critical-application downtime costs them at least ...

Learn
When Deloitte analyzed billions of user sessions for major retailers, they found that shaving just 0.1 seconds off ...
Learn
Every extra second your site takes to load can drop mobile conversions by up to 20%—that’s the stark finding from a ...