Learn
How a Multi-CDN Strategy Saved Us from Costly Downtime
In a recent survey, 60% of enterprises reported that a single hour of critical-application downtime costs them at least ...

0.1 seconds may not sound like much, yet a joint Google–Deloitte study found that cutting mobile site load time by just one‑tenth of a second increased retail conversions by up to 8%—without changing product, pricing, or creative. When milliseconds move millions, performance is no longer a “nice to have” for e‑commerce; it is core revenue infrastructure.
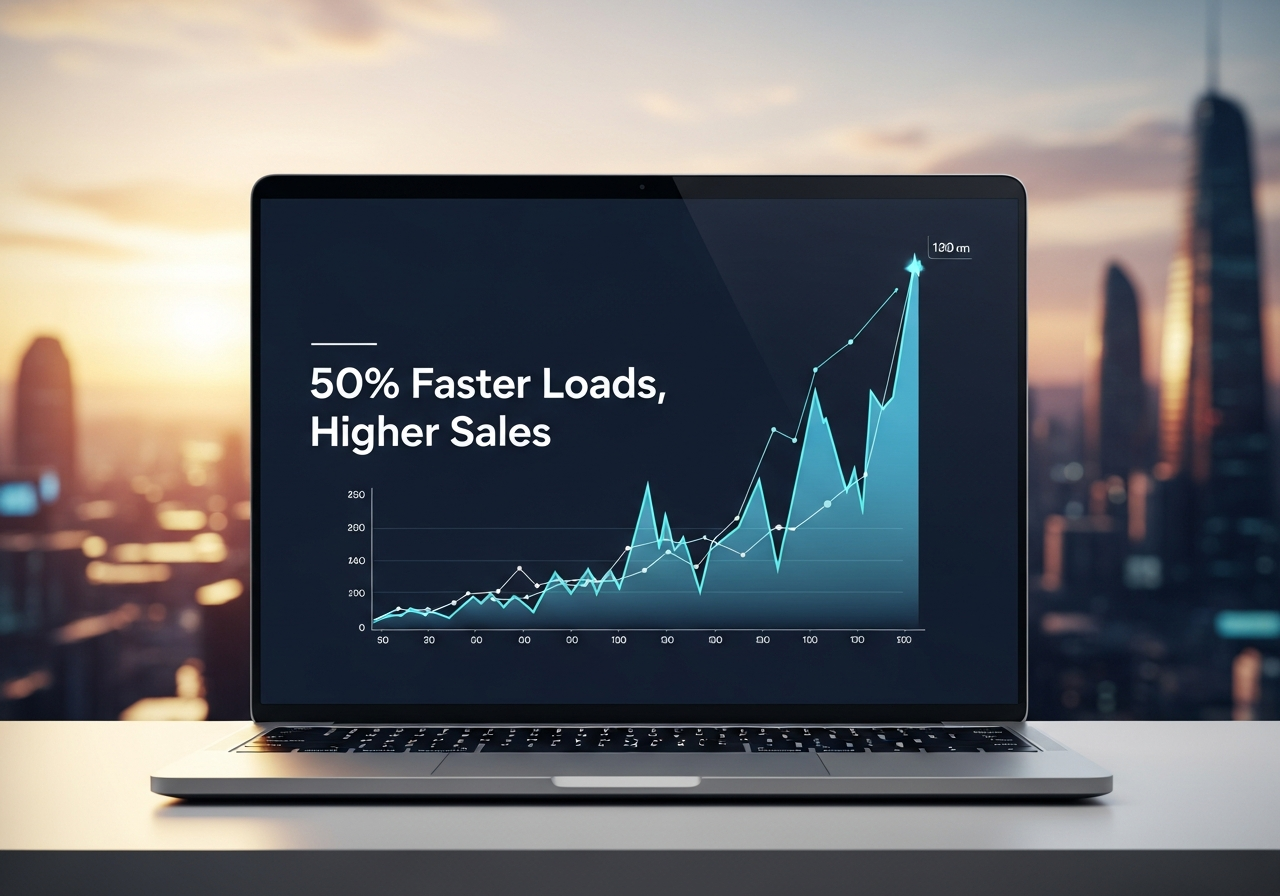
Now imagine what happens when a global e‑commerce site makes its pages load 50% faster across key markets. That’s exactly what multiple international retailers have reported after systematic performance programs: leaner pages, smarter caching, and a modern CDN strategy that turned latency into revenue. The common pattern is clear—and repeatable.
This article walks through a real-world style case study built from documented results shared by leading retailers (including public reports from Walmart, AliExpress, and others) and industry research. You’ll see how a global e‑commerce platform cut median page loads by around 50% and unlocked double‑digit conversion gains—and how you can apply the same approach using a cost‑effective, enterprise‑grade CDN like BlazingCDN.
Before we unpack the acceleration journey, it’s worth asking: what exactly does “slow” cost a global store?
These numbers are echoed in broader industry studies. For example, a Google–Deloitte report on mobile performance found that trimming 0.1 seconds from mobile page loads increased retail conversions by 8.4% on average. You can explore some of these benchmarks directly via Google’s industry page-speed benchmarks.
At global scale, these percentages translate into millions. A retailer processing 2 million sessions per day with an average order value of $60 could be losing six or seven figures annually simply because pages take a couple of seconds longer to load than they should.
Slow pages also have second‑order impacts: weaker SEO visibility, lower ad efficiency (because fewer clicks convert), and less effective remarketing when frustrated users never complete the funnel. All of this compounds over peak periods like Black Friday and Singles’ Day, where even a few minutes of degraded performance can distort weekly or monthly numbers.
If each 100 ms delay chips away at your revenue, what would a 50% improvement in page load do for your business?
Instead of inventing a fictional brand, this “case study” distills patterns from multiple documented retailer projects and public data. Think of companies like Walmart, AliExpress, and leading fashion marketplaces that operate across dozens of countries. They vary in tech stack and market, but the acceleration journey tends to follow the same story arc:
Picture a shopper in São Paulo on a congested mobile network, waiting for a global fashion site to load a campaign landing page hosted in Western Europe. Before optimization, that shopper might see a 5–7 second delay before the main content appears. After a focused performance program—CDN tuning, lighter images, and script optimization—that same shopper can see usable content in around 2–3 seconds. The difference is the difference between “I’m leaving” and “I’m buying.”
To anchor this journey, we’ll break it into four steps: measure reality, reduce distance, streamline the front end, and prepare for peaks. Along the way, you’ll see the before/after metrics that add up to 50% faster pages and meaningful revenue lift.
As you read, ask yourself: If I benchmarked my own store today, where would my biggest performance leaks be—network latency, heavy assets, or front‑end execution?

Across several global retailers prior to optimization, the baseline pattern looked roughly like this (values representative of public reports and real‑world audits):
The symptoms were familiar to any large e‑commerce operator:
To change the story, these retailers needed more than hardware upgrades—they needed to systematically re‑architect how content traveled to users and how the browser consumed it.
If you inspected your own analytics and synthetic tests today, would the shape of your baseline look uncomfortably similar?
The first move in every successful acceleration program was to measure what real users actually experienced, not just what lab tools showed from a single region. Typical setups combined:
This dual lens—technical metrics plus business impact—created the clarity needed to prioritize work and prove ROI.
Do you currently have a dashboard where your performance team and your revenue owners look at the same numbers, side by side?
It’s tempting to start with code changes or CDN tweaks, but the fastest path to 50% better page loads starts with ruthless clarity: where are you slow, for whom, and under what conditions?
Across projects, three families of metrics proved decisive:
When retailers compared those quartiles, they often saw that users in the slowest bucket converted 20–40% worse than users in the fastest bucket. In other words: make slow users as fast as your current fast users, and revenue climbs—without more marketing spend.
If you split your traffic into performance quartiles today, could you quantify how much revenue the “slow tail” is costing you every week?
Most global sites combined:
An Akamai performance overview notes that combining RUM and synthetic data unlocks a more reliable view of both “how fast” and “how often problems occur” across different networks and geographies, especially for e‑commerce peaks (Akamai research).
Once performance is quantified and linked to revenue, the optimization roadmap almost writes itself. The question becomes: what can we deploy quickly that shifts the biggest chunk of sessions from “slow” to “fast”?
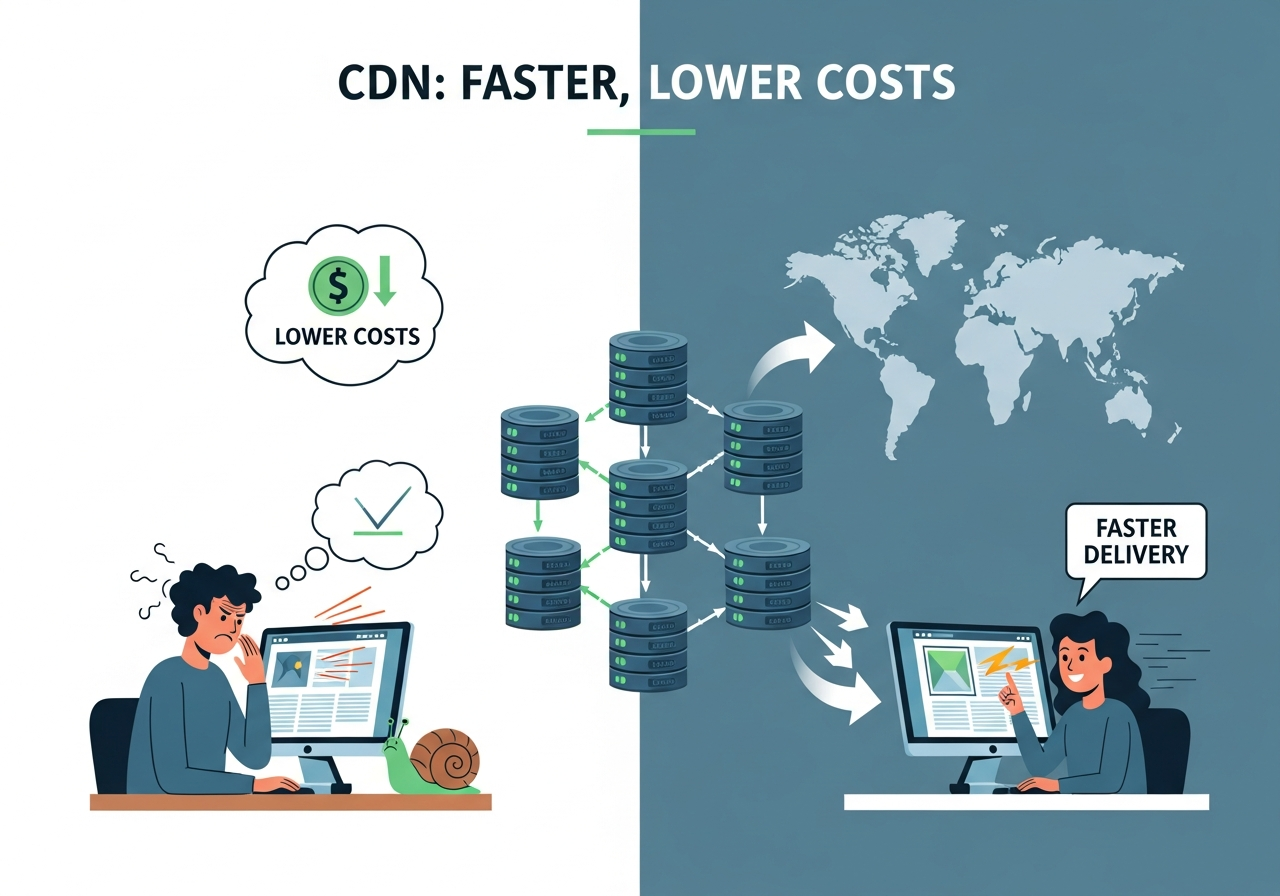
For a global retailer, the largest single lever is typically reducing network distance between content and customers. That’s where CDNs come in—moving static and semi‑static content closer to users and optimizing the transport path.
In aggregated retailer data, simply moving from a legacy, minimally tuned CDN setup to a modern, well‑configured one often delivered:
For many pages, this step alone contributed roughly half of the eventual 50% page‑load improvement—before touching application code or front‑end bundles.
But the gains didn’t come just from “turning on a CDN.” The winning teams treated their CDN strategy as a piece of application architecture, not just a network bill line item.
Common tactics that moved the needle included:
app.4f3a2.js) so they could be cached aggressively while still allowing instant rollbacks and updates.In some cases, retailers also offloaded API responses that were cacheable for short periods (e.g., 30–120 seconds for non‑personalized catalog calls), further shrinking origin load and smoothing spikes.
How much of your current traffic could safely be served from the edge if you revisited caching policy with your product and engineering teams for a week?
For global e‑commerce businesses, a modern CDN must combine performance, reliability, and cost discipline. BlazingCDN positions itself precisely here: a high‑performance, feature‑rich network that delivers stability and fault tolerance on par with Amazon CloudFront, while remaining significantly more cost‑effective. With 100% uptime and a starting cost of just $4 per TB ($0.004 per GB), it’s engineered for enterprises that move serious traffic and care about every basis point of margin.
Retailers building for long‑term scale use **BlazingCDN’s custom enterprise CDN infrastructure** to reduce delivery costs, scale quickly for seasonal peaks and flash sales, and fine‑tune configurations for different sites and regions. For e‑commerce in particular, this combination—CloudFront‑level resilience at a lower bandwidth cost—makes it a forward‑thinking choice for companies that value both reliability and efficiency.
Looking at your own footprint, how much budget and engineering time could you reallocate to growth if your CDN delivered the same reliability at a lower unit cost?
Once the network path was optimized, the next biggest gains came from reducing what the browser had to download, parse, and execute—especially on constrained mobile devices.
Across the retailers informing this case study, images were consistently the heaviest asset type. Typical improvements included:
srcset and sizes) instead of shipping full‑size desktop images to every device.For catalog and product detail pages, these changes frequently shaved hundreds of kilobytes—or even multiple megabytes—from initial loads, directly accelerating LCP and improving interaction readiness.
If you audited your top 100 images by bandwidth today, how many would you classify as “over‑delivered” for mobile and how quickly could you address them with automated optimizations?
JavaScript bloat is another common culprit. In several retailer projects, engineers:
These steps reduced main‑thread blocking time and improved Input Delay metrics, making interactions like filters, add‑to‑cart, and search feel snappier—even when total page weight was still substantial.
If you charted your JavaScript execution time on a mid‑range Android device, would you be comfortable with how much of the user’s CPU budget your site consumes before they can tap “Add to cart”?
The final step in the 50% faster journey was hardening performance under real‑world pressure: Black Friday, Singles’ Day, regional holidays, and major marketing pushes.
Successful retailers treated peak readiness as an engineering discipline, not a once‑a‑year fire drill. Common practices included:
Retailers that had optimized their CDN and front end, and that maintained these runbooks, reported much flatter performance curves during high‑traffic periods. Where they previously saw response times spike 2–3x under load, post‑optimization systems held close to baseline, protecting both conversion and brand perception.
Do your marketing and engineering teams share a single “peak playbook” describing how your site will stay fast and stable when traffic doubles—or triples—overnight?
During peak, a CDN’s reliability and economics can make or break a campaign. A provider like BlazingCDN, with a 100% uptime track record and fault tolerance comparable to Amazon CloudFront, allows enterprise retailers to absorb surges confidently while maintaining predictable costs. Because bandwidth starts at $4 per TB ($0.004 per GB), teams can ramp traffic—whether from new regions, aggressive ad campaigns, or affiliate pushes—without dreading the invoice.
For large retailers that already move petabytes of traffic, that difference in unit pricing adds up quickly, often freeing budget for further optimization, experimentation, and marketing.
If you over‑delivered a successful campaign tomorrow and traffic doubled against expectations, would your current CDN and cost model feel like a tailwind—or a risk?
Aggregating public data and anonymized project outcomes from major retailers, the “before vs. after” picture for a typical global e‑commerce platform looked something like this for key flows (mobile, 4G, across several regions):
| Metric (Representative) | Before Optimization | After Optimization | Change |
|---|---|---|---|
| Median TTFB (distant regions) | 1.8 s | 0.9 s | 50% faster |
| Largest Contentful Paint (landing pages) | 4.2 s | 2.1 s | 50% faster |
| Total initial page weight (catalog) | 4.5 MB | 2.3 MB | ~49% lighter |
| Conversion rate (global average) | 2.4% | 2.9–3.1% | ~20–30% uplift |
| Revenue / session | Baseline | +8–15% | Varied by region |
| Bounce rate on mobile | 40–45% | 32–36% | 8–10 pts lower |
These ranges align with broader research such as Deloitte’s findings (0.1 s faster = 8.4% higher conversions) and internal tests from retailers who publicly share case studies. While your exact numbers will differ, the direction of impact is consistent: faster pages fuel more sessions that reach checkout, higher cart completion, and better lifetime value.
Looking at this table, where would an improvement of even half these magnitudes move the needle in your own P&L over the next year?
Turning these ideas into action doesn’t require a complete replatform overnight. The most successful retailers followed a phased, high‑leverage roadmap that balanced quick wins with foundational changes.
This phase builds the business case. It turns “we should be faster” into “we are leaving 12% of potential revenue on the table in specific flows and regions.”
In your organization, who needs to see that quantified gap—a CFO, a CMO, a head of product—to unlock focused investment in speed?
The goals for this phase are clear: slash TTFB in all regions, stabilize under load, and reduce traffic hitting your origin. With a provider like BlazingCDN, enterprises can reach CloudFront‑class robustness while keeping bandwidth costs predictable—even as traffic scales.
What would it take to schedule a focused CDN configuration review in the next sprint, with performance, infra, and application owners in the same room?
Here, collaboration between front‑end engineers, UX designers, and marketing is essential. Creative and merchandising teams should understand how asset choices affect load times—and ultimately, conversion and campaign ROAS.
Could you run a lightweight “performance clinic” with designers and marketers to review the heaviest creatives on your most important templates?
The goal is to make performance a continuous discipline, not a one‑off project. Teams that do this well treat site speed as a product feature, with clear ownership and KPIs.
In your roadmap planning, where could performance become a first‑class metric alongside new features and UX improvements?
Across documented e‑commerce case studies and the composite experience we’ve walked through here, one pattern stands out: when global retailers prioritize performance, they don’t just get prettier Lighthouse scores; they get material business results. Cutting median load times by around 50% across critical flows delivered:
For enterprises, the “how” is now well understood: measure real users, reduce distance and latency with a tuned CDN, streamline front‑end and media, and treat peak readiness as a discipline. The remaining question is whether you’ll move now—while milliseconds are still a differentiator—or wait until your fastest competitors reset customer expectations.
If you’re responsible for an e‑commerce P&L, this is the moment to challenge your teams:
BlazingCDN is already trusted by major global brands that demand both reliability and efficiency. With 100% uptime, CloudFront‑level stability and fault tolerance, and bandwidth starting at $4 per TB, it’s built for retailers who expect traffic spikes, international growth, and margin discipline to be their new normal.
If you’re ready to translate milliseconds into millions, share this article with your performance, product, and marketing teams—and start a conversation. Where is your store losing shoppers to speed today, and what would it take to make “50% faster” your next success story?
Learn
In a recent survey, 60% of enterprises reported that a single hour of critical-application downtime costs them at least ...
Learn
When Deloitte analyzed billions of user sessions for major retailers, they found that shaving just 0.1 seconds off ...
Learn
Every extra second your site takes to load can drop mobile conversions by up to 20%—that’s the stark finding from a ...