
Learn
Best Video Streaming CDN in 2026? 7 Providers
Best CDN for Video Streaming in 2026: 7 Providers Compared A single rebuffer event at the two-second mark costs you 8% ...
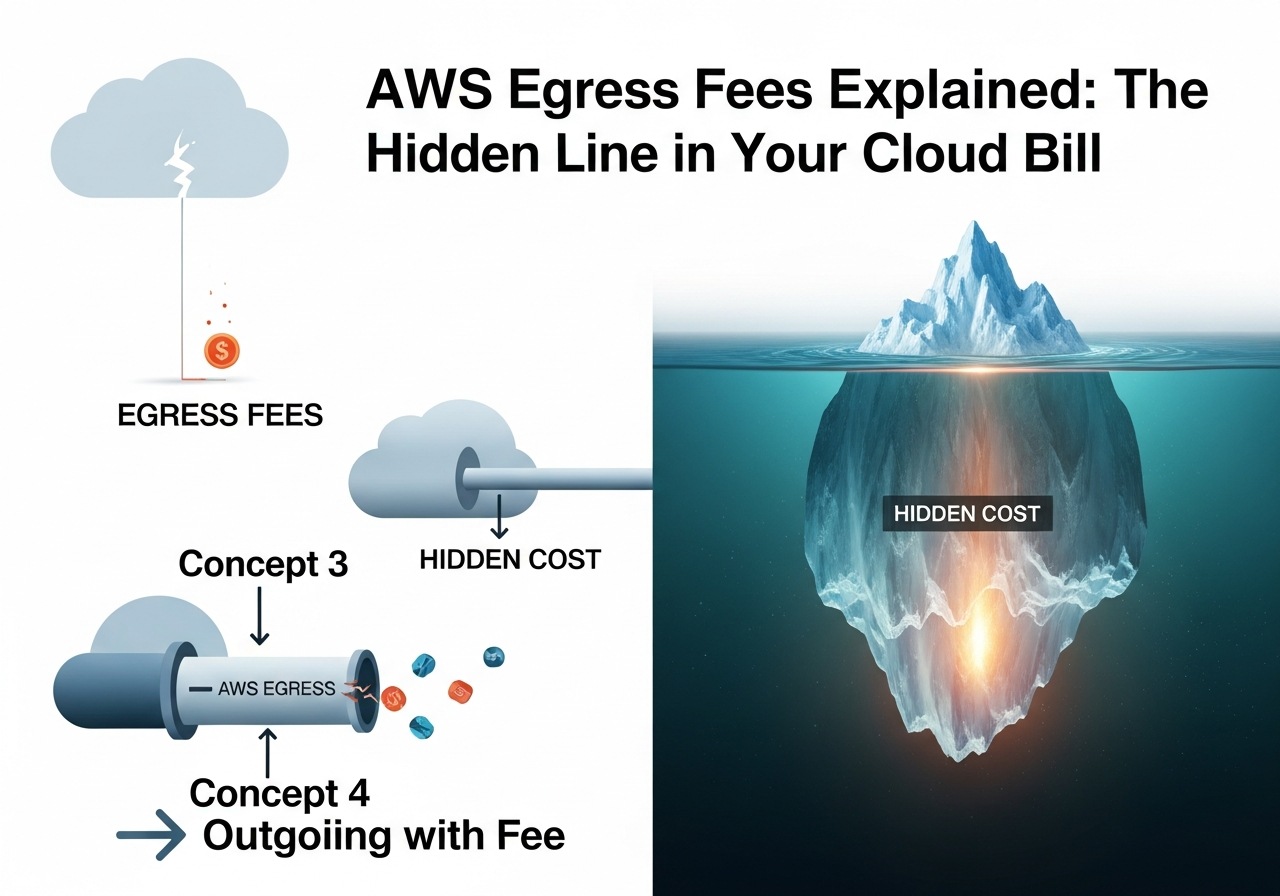
A team ships a cache-friendly service, cuts origin CPU by 60%, and still watches the AWS bill climb. The culprit is often not compute, storage, or requests. It is data motion. On AWS, a single response path can stack internet egress, inter-AZ transfer, NAT data processing, and load balancer traversal into one expensive byte stream. At scale, the hidden line is not hidden at all. It is usually the line that turns a healthy gross margin into a finance incident.

The first thing to internalize is that AWS data transfer costs are not one number. They are a graph problem. The same 1 GB object can be billed differently depending on whether it exits through EC2, S3, or CloudFront, whether the request path crosses Availability Zones, whether a NAT gateway is in the path, and whether the return path hairpins through another network hop.
That is why naive fixes usually fail. Compressing payloads helps, but not if the architecture still forces cross-zone traffic twice per request. Moving everything behind private subnets helps security posture, but not if every patch download and third-party API call now pays NAT processing plus standard transfer. Turning on multi-AZ can improve resilience while quietly multiplying east-west transfer charges.
As of 2026, AWS still prices internet egress and internal transfer as separate dimensions, with service-specific rules. Inbound internet traffic is generally free, but data transfer out to the internet is charged by service and Region. Cross-AZ traffic is commonly billed, and some managed network components add their own per-GB processing charges on top. That is the mechanical reason “what is AWS data transfer out on my bill” remains one of the most common cost questions in large AWS estates.
When engineers say “AWS egress fees,” they usually mean bytes sent from AWS to end users. That is the visible line item. But the expensive surprises usually come from paths that are not obvious in application diagrams:
One of the clearest public statements from AWS in 2026 is on Network Load Balancer behavior: when traffic crosses AZ boundaries, AWS applies an inter-zone charge of $0.01 per GB in each direction. That matters because it means a request can incur a client-to-NLB cross-zone charge and then an NLB-to-target cross-zone charge again. Architects who think in requests per second often underestimate how quickly this turns into meaningful monthly spend once payloads stop being tiny.
A simple mental model helps. If a 20 GB/s steady-state media workload crosses an AZ boundary only once, that is roughly 51.8 PB per month of billable cross-zone traffic. At $0.01/GB, the transfer component alone is roughly $518,000 monthly before you account for internet egress, request charges, shielding layers, or retries. The scale shock is real because the path penalty is multiplicative, not additive.
AWS’s own guidance still calls out NAT gateway data processing as a distinct cost domain. If private workloads reach public AWS endpoints or external services through NAT, you pay hourly gateway charges and per-GB processing, and you may still pay standard data transfer depending on the path. This is why “why is data transfer on my AWS bill so high” often turns out to be a private subnet design issue, not an application issue.
Let’s make the abstractions concrete with back-of-the-envelope numbers using public AWS pricing mechanics and explicit assumptions. These are not synthetic vendor benchmarks. They are architecture math.
Assume a workload serving 300 TB/month of responses directly from EC2 in one Region. Ignore requests and compute. The dominant charge is AWS data transfer out to the internet. For many teams, this is the first point where “how much does AWS charge for data transfer out to the internet” stops being a documentation question and becomes a product-margin question.
Assume the same 300 TB/month, but 60% of flows traverse cross-AZ between load balancer and target because target placement is uneven. The cross-zone component alone is about 184.3 TB/month. At $0.01/GB, that is roughly $1,843 of additional transfer in one direction. If the path crosses zones twice, double it. For high-bitrate streaming and large object delivery, that extra layer can rival some managed service bills.
Assume private nodes in autoscaling groups pull 80 TB/month through NAT gateways. AWS VPC pricing publicly documents a per-GB NAT data processing charge in addition to hourly gateway cost. At $0.045/GB for processing, 80 TB is about $3,600 monthly in NAT processing alone, before any related transfer charges. This is one reason centralized egress VPCs look clean on a diagram and ugly in a CUR export.
If you do not break the bill into paths, you will optimize the wrong thing. The Cost and Usage Report usually exposes enough detail to separate internet egress, inter-AZ transfer, and service-specific processing. The useful question is not “what service is expensive?” It is “which byte path is expensive?”
For many teams, the fastest win is simply proving whether bytes are leaving from the right service. If users are downloading from S3 or EC2 directly when they should be hitting a CDN cache, you are paying premium origin economics for edge-deliverable traffic.
The cheapest byte is the one that never leaves origin. The second-cheapest is the one that leaves a lower-cost delivery tier instead of EC2 or S3 direct internet egress. This sounds obvious, but the operational trap is partial CDN adoption: API traffic uses the CDN, large static bundles and media URLs bypass it, signed download links point straight at S3, or cache keys are fragmented badly enough that hit ratio never climbs.
For media, software distribution, and large object delivery, this is where a cost-optimized enterprise-grade CDN can materially change the unit economics. BlazingCDN fits this exact design point: stability and fault tolerance comparable to Amazon CloudFront, significantly more cost-effective delivery at scale, 100% uptime, flexible configuration, and fast scaling during demand spikes. Pricing starts at $4 per TB, and at high volume it scales down to $2 per TB at 2 PB and above, with migration in 1 hour and no other costs. If you are actively modeling replacement cost for origin egress, BlazingCDN pricing is the number to compare against your current $/GB path cost, not just against another CDN’s marketing page.
If your load balancer nodes and targets are in different AZs for a large fraction of flows, your architecture is paying a tax for placement drift. The fix is not “disable multi-AZ.” The fix is to improve locality:
If private workloads are fetching from AWS services over public endpoints through NAT, replace that with VPC endpoints where possible. This avoids NAT processing charges and often simplifies egress accounting. AWS’s own NAT guidance has been saying the quiet part out loud for years: if most of your NAT traffic is to AWS services, endpoints usually beat NAT on both cost and path efficiency.
Inter-Region transfer is one of the easiest ways to create a stealth bill. Teams enable replication, cross-Region analytics reads, or active-active data fanout without modeling the byte cost. If the workload does not need low-RPO multi-Region data movement, do not pay for it.
| Delivery path | Price/TB signal | Operational upside | Where the bill usually hurts | Best fit |
|---|---|---|---|---|
| BlazingCDN in front of AWS origin | Starts at $4/TB, down to $2/TB at 2 PB+ | Low origin egress pressure, flexible configuration, fast scaling, predictable delivery economics | Origin miss traffic and cache-key mistakes | Media, downloads, patch distribution, high-volume static and semi-static delivery |
| Amazon CloudFront in front of AWS origin | Varies by geography and plan | Tight AWS integration, origin-to-CloudFront transfer from several AWS origins is often free | Viewer egress pricing and edge feature add-ons if the workload is mostly bandwidth | Teams standardized on AWS controls and workflows |
| Direct from S3 or EC2 | Highest unit-cost risk for internet delivery | Simple to launch | AWS data transfer out, bursty bills, no cache offload | Low-volume internal tools or temporary workloads |
The fastest path to action is to join billing data with network topology. You want one view that answers three questions:
If your CUR lands in S3 and is queryable in Athena, start with a coarse filter on transfer-related usage types and then break down by resource and AZ.
SELECT
  line_item_product_code,
  line_item_usage_type,
  product_region,
  line_item_availability_zone,
  SUM(line_item_usage_amount) AS usage_amount,
  SUM(line_item_unblended_cost) AS cost_usd
FROM cur_db.cur_table
WHERE bill_billing_period_start_date = date '2026-05-01'
  AND (
    line_item_usage_type LIKE '%DataTransfer%'
    OR line_item_usage_type LIKE '%NatGateway%'
  )
GROUP BY
  line_item_product_code,
  line_item_usage_type,
  product_region,
  line_item_availability_zone
ORDER BY cost_usd DESC;
Then correlate that with VPC Flow Logs or load balancer metrics. If you see one AZ with disproportionate target traffic and another with disproportionate client ingress, you likely have locality drift. If NAT bytes spike during deploy windows, package management and artifact pulls are probably flowing the wrong way.
This matters because “how to reduce AWS data transfer costs” is rarely one optimization. It is usually a sequence of path deletions.
Cost optimization around egress has sharp edges. Some are obvious. Some are not.
If you chase perfect AZ locality, you can end up with brittle zonal capacity and ugly failover behavior. The target state is not zero cross-zone traffic at all times. It is low cross-zone traffic during healthy operation, with explicit acceptance that failover events temporarily cost more.
Teams often move bandwidth to a CDN and then discover the miss ratio stays high because of signed URL entropy, query-string fragmentation, or response headers that prevent reuse. In those cases, the bill barely moves because the origin still serves most bytes.
The trade is usually worth it, but it does create operational surface area: policy management, route validation, endpoint quotas, and cost tracking by endpoint type. If your platform team is small, endpoint hygiene needs automation or it becomes its own tax.
Security teams often prefer shared inspection and egress. The bill often disagrees. Hairpinning large payloads through centralized constructs creates extra transfer and processing tolls that do not show up in high-level architecture reviews. If the security requirement is non-negotiable, at least segment heavy-content paths away from generic control-plane egress.
If your top line item is already internet delivery of large cacheable objects, the cost case is straightforward. If your spend is mostly east-west microservice chatter, then this article is only partially your problem statement.
Run one query: break your last full month of transfer spend into internet egress, inter-AZ, inter-Region, and processing tolls. Then pick the single most expensive path and delete one hop from it. Not optimize it. Delete it.
If you want a useful engineering debate, ask your team this: for your top 10 TB/day path, are you paying for bytes, for topology mistakes, or for both? Most AWS bills answer that question very clearly once you stop reading by service and start reading by path.
Learn
Best CDN for Video Streaming in 2026: 7 Providers Compared A single rebuffer event at the two-second mark costs you 8% ...

Learn
Video CDN Providers Compared: BlazingCDN vs Cloudflare vs Akamai for OTT If you are choosing a video CDN for an OTT ...

Learn
Video CDN Pricing Explained: How to Stop Overpaying for Streaming Bandwidth Video already accounts for 38% of total ...