
Pricing - Pricing & Costs
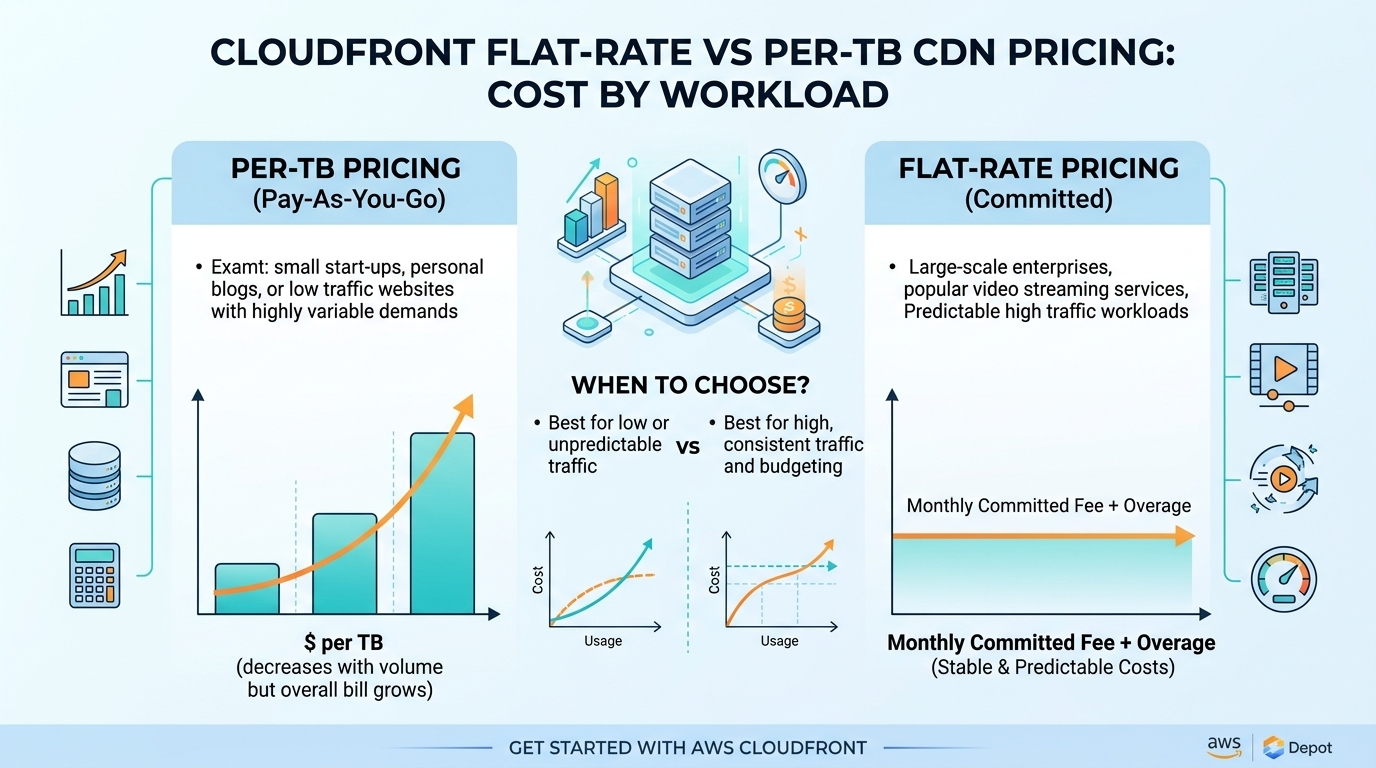
CloudFront Flat-Rate vs Per-TB CDN Pricing: Cost by Workload
Amazon CloudFront's $15 Pro flat-rate plan is the cheapest way to serve up to 50 TB a month, but only if your average ...
Run the amazon cloudfront pricing calculator with 100 TB of monthly egress and it will hand you a number that is, in most production environments, between 15% and 40% below what you will actually be invoiced. The calculator is not wrong. It models exactly what AWS tells it to model: data transfer out to the internet, request counts, and a handful of optional line items. It does not model your cache hit ratio, your origin shield fill traffic, your invalidation habits, your Lambda@Edge concurrency, or the cross-region replication you added to survive an origin outage. This article walks the calculator inputs field by field, shows two worked CloudFront cost estimates at very different traffic profiles, decodes price classes and request pricing as they stand in 2026, and then catalogues the charges the estimator never sees.

The AWS Pricing Calculator's CloudFront module has three mandatory input groups and several optional ones. Understanding which of them dominate your bill saves you from tuning the wrong knob.
AWS publishes tiered egress rates that step down as monthly volume grows. As of 2026 the on-demand pricing for the first 10 TB per month sits at roughly $0.085/GB in North America and Europe, $0.114/GB in South America and the Middle East, and around $0.120/GB in India. Above 150 TB/month the North America rate falls to about $0.020/GB. HTTPS requests are approximately $0.0120 per 10,000 in North America and Europe, higher elsewhere.
Two structural facts matter more than the rate card itself. First, CloudFront's free tier since 2024 includes 1 TB of egress and 10 million requests per month, permanently, not just for new accounts. Second, data transfer from AWS origins (S3, EC2, ALB, MediaPackage) into CloudFront is $0.00 per GB. If you are still seeing origin egress charges, your traffic is bypassing CloudFront somewhere.
| Region group | First 10 TB (per GB) | Next 40 TB (per GB) | HTTPS req / 10k |
|---|---|---|---|
| North America | $0.085 | $0.080 | $0.0120 |
| Europe / Israel | $0.085 | $0.080 | $0.0120 |
| South America | $0.110 | $0.105 | $0.0220 |
| India | $0.109 | $0.104 | $0.0180 |
| Australia / NZ | $0.114 | $0.098 | $0.0130 |
Treat these as 2026 list-price reference points for validating calculator output, not as a contract. Enterprise Discount Programs and CloudFront Security Savings Bundles change the effective rate substantially.
The cloudfront pricing calculator lets you pick a price class, and this single dropdown can swing an estimate by 20% or more. Price Class All uses every edge location. Price Class 200 excludes South America and Australia/New Zealand. Price Class 100 restricts delivery to North America, Europe, and Israel.
The trap: restricting price class does not block users in excluded regions. It routes them to the nearest permitted edge. A Sydney user on Price Class 100 gets served from Tokyo or the US West Coast, adding 100–180 ms of RTT and degrading TLS handshake and TCP slow-start behaviour on every cold connection. For a static marketing site that is fine. For an interactive SaaS dashboard it is a measurable regression in p95 time-to-first-byte.
Practical rule for 2026: check your actual traffic distribution in CloudFront's Popular Objects and Viewer Location reports before selecting a class. If under 3% of requests originate from the excluded regions, Price Class 200 is usually free money. If you have paying customers there, it is not.
Profile: B2B analytics product, mostly API responses and a single-page app bundle. Traffic split 60% North America, 30% Europe, 10% rest of world. 12 TB egress, 320 million HTTPS requests, 400 GB of upload traffic to origin, Price Class All, one CloudFront Function for header rewriting at 320 million invocations.
Calculator output: roughly $1,390/month. Real-world invoice for this profile typically lands between $1,500 and $1,750. The delta comes from cache misses generating unpriced-in origin compute, real-time log delivery at $0.01 per million lines, and invalidation overruns during weekly deploys.
Profile: VOD and live HLS delivery, segment-based, high cache hit ratio, global audience skewed toward Europe and Southeast Asia. 900 TB egress, 4.2 billion HTTPS requests, Origin Shield enabled, Price Class All.
Calculator output: roughly $37,500/month before any negotiated discount. At this volume nobody pays list. A Security Savings Bundle or EDP commonly lands effective rates 25–40% lower, which puts the real number near $23,000–28,000. That is the negotiation baseline you should walk in with, and the number the aws cdn cost conversation should start from rather than the raw calculator figure.
This is the section the top-ranking calculator guides skip. Six categories routinely appear on the invoice and never in the estimate.
Before you commit a budget number, do three things. Pull the last 30 days of Cost and Usage Report data filtered to the CloudFront service and compare actual per-GB effective rate against your calculator's implied rate. Pull your distribution's cache statistics report and note the byte-level hit ratio, not the request-level one, because a 95% request hit ratio with misses concentrated on large objects still means heavy origin fill. Then multiply the calculator output by 1.2 as a working contingency for the unmodelled items above. If the resulting number changes your architecture decision, the architecture decision was marginal to begin with.
CloudFront's economics work well when your origin is already in AWS, you are inside an EDP, and your traffic is request-heavy rather than byte-heavy. They work poorly for pure bandwidth workloads at scale, where you are paying platform-integration pricing for what is fundamentally byte delivery.
The honest competitive set at that end of the market is Bunny.net, CDN77, Gcore, KeyCDN, Medianova, and Fastly for streaming-specific needs. Bunny.net has strong per-region pricing granularity and a good developer experience. CDN77 is well established in European video delivery. Fastly's VCL-level programmability at the edge remains genuinely ahead for teams that need it.
BlazingCDN sits in that same league with predictable volume-based pricing on NVMe SSD edge infrastructure, delivering stability and fault tolerance comparable to Amazon CloudFront while costing materially less per delivered terabyte. Pricing starts at $100/month for up to 25 TB with additional GB at $0.004, and steps down to $1,500/month for 500 TB, $2,500/month for 1,000 TB, and $4,000/month for 2,000 TB with overage at $0.002/GB — roughly $2 per TB at the top tier, against a blended CloudFront list rate closer to $30–35 per TB at comparable volume. With 100% uptime, flexible configuration, one-hour onboarding, and fast scaling under demand spikes, it is worth benchmarking against your own numbers before renewing a large commit. Compare the tiers directly on BlazingCDN's pricing page.
Run the 900 TB example through both models. CloudFront at negotiated rates lands near $25,000. A $4,000 flat tier covering 2,000 TB is a different order of magnitude. That gap is why bandwidth-dominant workloads increasingly split delivery: AWS-integrated paths stay on CloudFront, bulk segment and package delivery moves elsewhere.
It is accurate for the line items it models — egress, requests, and named optional features — typically within a few percent if your regional split is correct. It is not accurate as a total-cost figure because it excludes origin-side compute triggered by cache misses, log storage, and replication. Apply a 15–25% contingency depending on your byte-level cache hit ratio.
Yes. CloudFront's perpetual free tier covers 1 TB of data transfer out, 10 million HTTP/HTTPS requests, and 2 million CloudFront Function invocations per month. It applies to all accounts, not only new ones, and the calculator will subtract it if you enable the free tier toggle.
Only if your Viewer Location report shows negligible traffic from South America, Australia, New Zealand, and parts of Asia. Price Class 100 does not block those users, it just serves them from further away, adding significant RTT. Check the report first; the savings are usually 10–20% of egress and rarely worth a p95 latency regression on paying users.
The usual suspects in order of frequency: invalidation charges beyond the 1,000 free paths, real-time log delivery volume, Lambda@Edge GB-seconds, and origin-side costs from a lower-than-expected cache hit ratio. Pull the Cost and Usage Report grouped by usage type to see which one dominates.
Data transfer out from AWS origins into CloudFront is billed at $0.00 per GB. You still pay for the S3 GET requests themselves, and for any request-per-object charges at the origin. High cache miss rates on small objects can therefore generate meaningful S3 request charges even with free egress.
They provide a discount of up to 30% on CloudFront usage in exchange for a one-year commitment to a minimum monthly spend, plus bundled WAF credit. The pricing calculator does not model them, so at volumes above roughly 50 TB/month you should treat calculator output as a pre-discount ceiling and negotiate from there.
Pull 30 days of your Cost and Usage Report, filter to CloudFront, and divide total cost by total GB delivered. That single number — your true effective cost per GB — is the only figure worth comparing against any calculator, any competitor quote, or any commit proposal. Then pull your byte-level cache hit ratio from the cache statistics report. If it is below 90% on a byte basis, your next cost win is in cache-key normalisation and TTL policy, not in a provider switch.
Post your effective per-GB number and your byte hit ratio. The spread between teams running the same nominal traffic is usually 3x, and almost all of it comes down to cache key hygiene rather than rate cards.

Heavy traffic.
Light bill.
The CDN for video and large traffic
Pricing - Pricing & Costs
Amazon CloudFront's $15 Pro flat-rate plan is the cheapest way to serve up to 50 TB a month, but only if your average ...

Compare
By every public yardstick, the biggest CDN providers in 2026 are Akamai, Cloudflare and Amazon CloudFront, followed by ...
Pricing - Pricing & Costs
Amazon CloudFront flat-rate pricing comes in four tiers: Free ($0), Pro ($15 a month), Business ($200) and Premium ...